NOTE: Gray indicates insufficient data or a suppressed estimate.
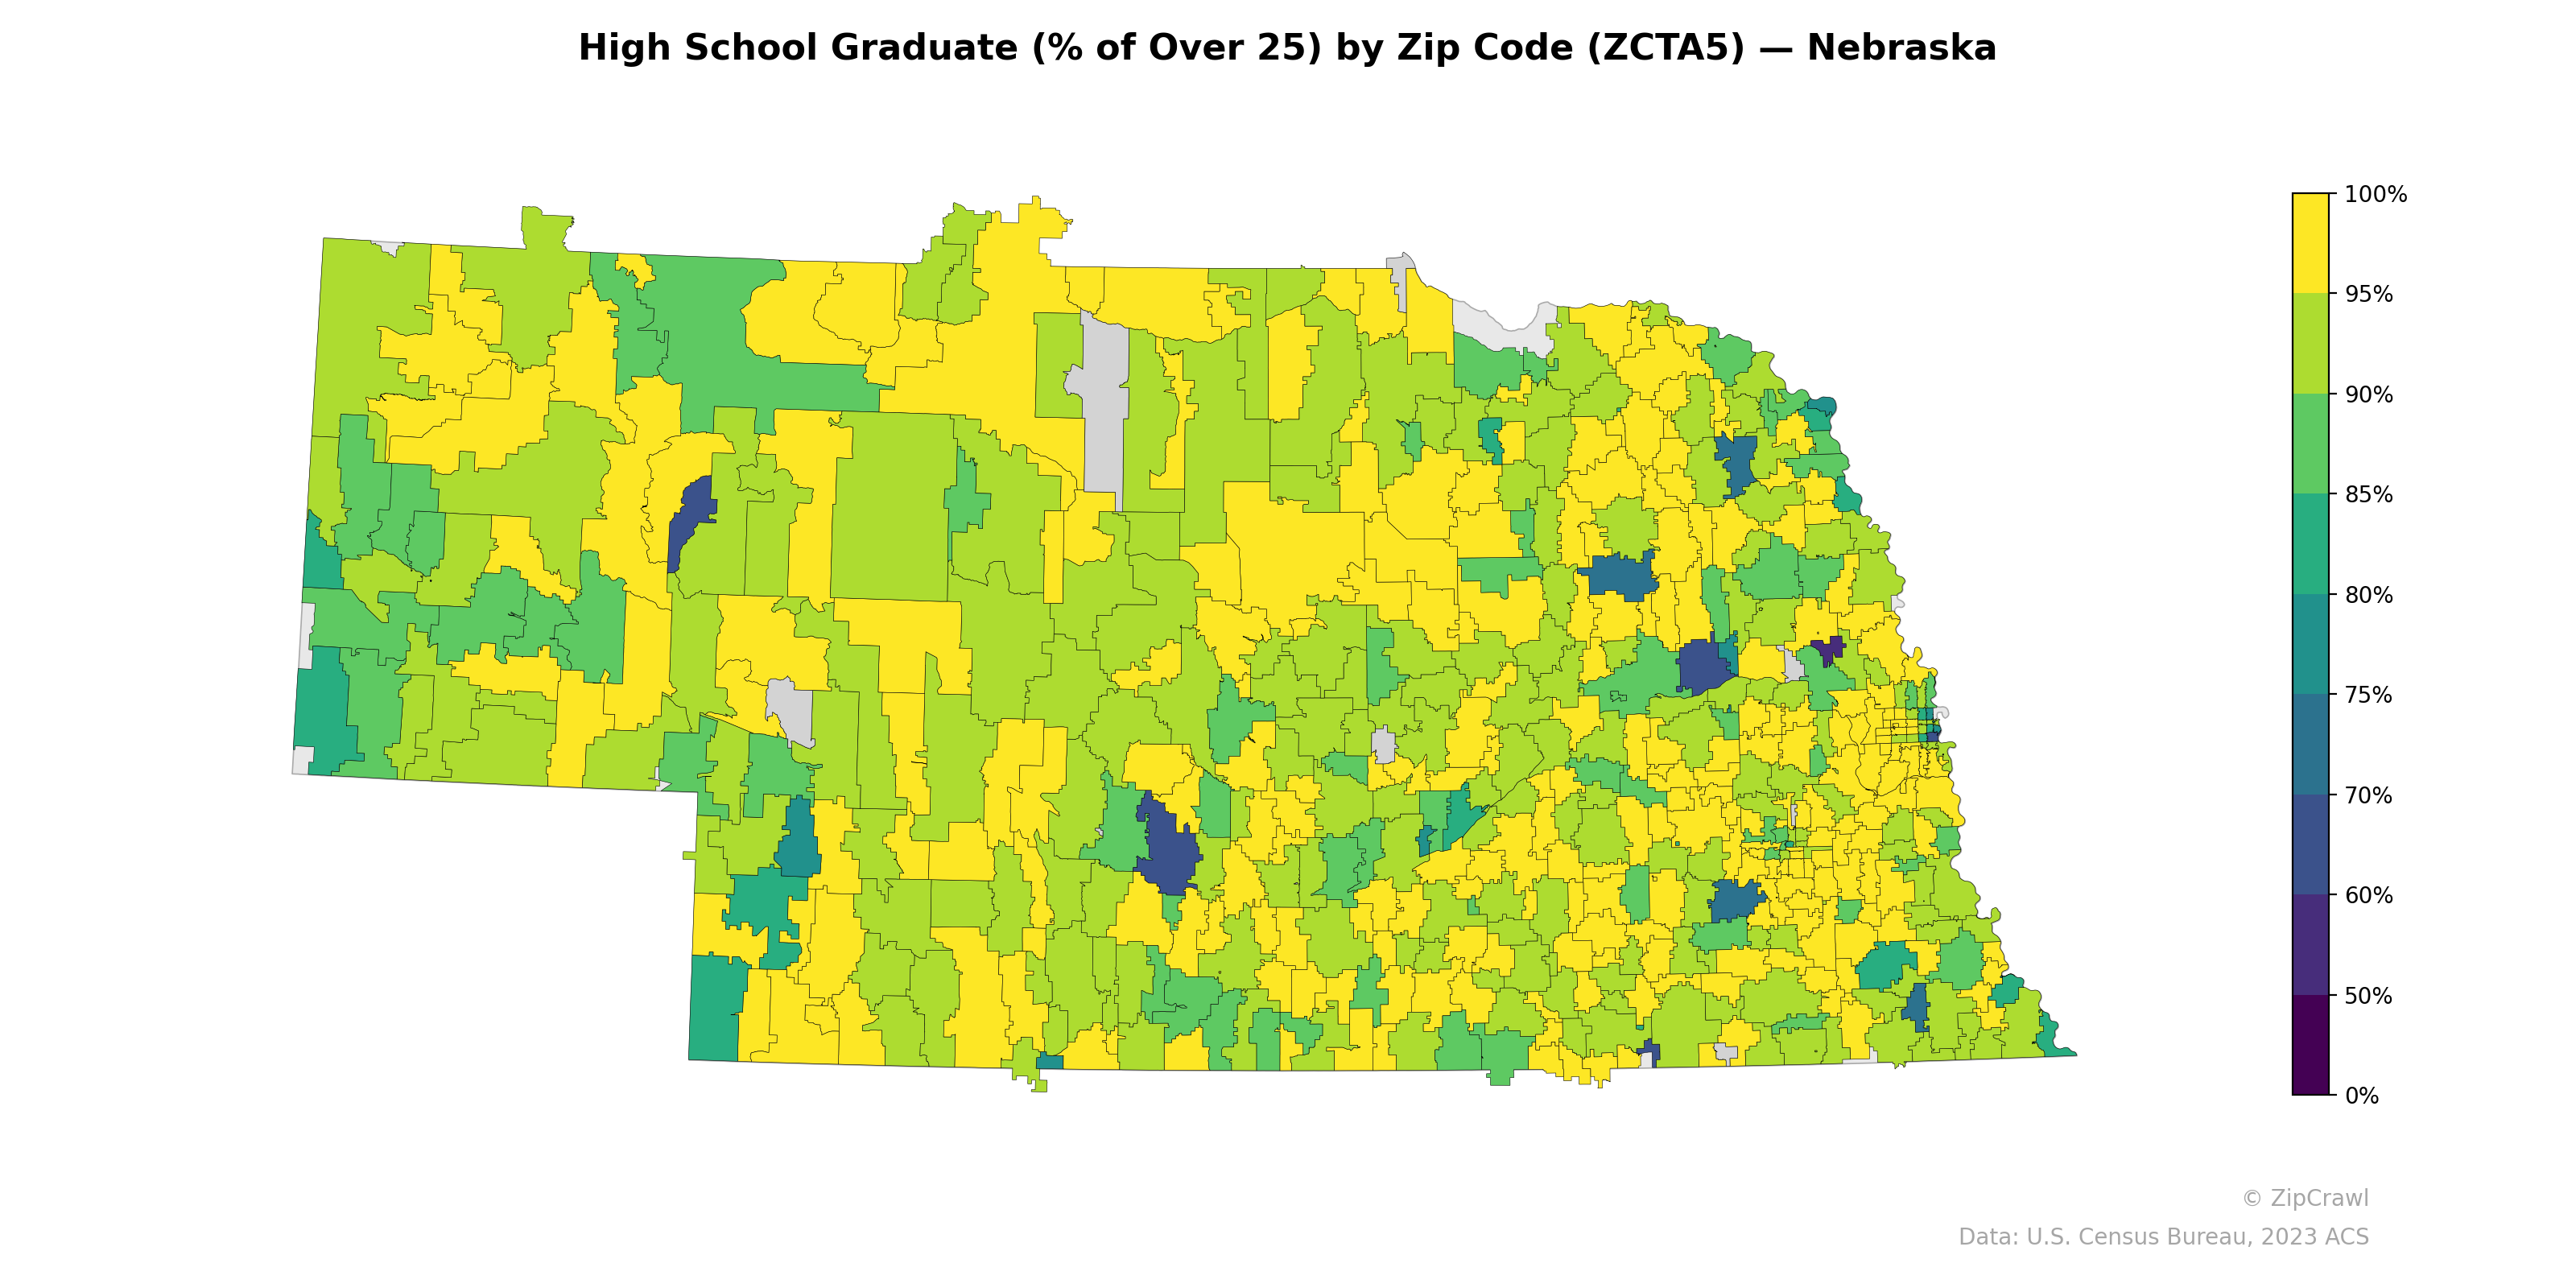
High school graduation rates across Nebraska zip codes generally exceed 85% in rural western and central regions, with numerous zip codes reaching 95–100% (bright yellow), reflecting the educational attainment typical of smaller, less diverse agricultural communities. Notable low-graduation clusters (dark blue/teal, below 60%) appear in the south-central part of the state—likely corresponding to meatpacking communities such as Lexington and Grand Island—as well as in portions of the Omaha metro area in the far east, where immigrant populations and urban poverty contribute to lower attainment figures. The southeastern corner of the state also displays a patchwork of moderate-to-low rates, contrasting sharply with the uniformly high attainment seen across the Sandhills and Panhandle regions.
Data: U.S. Census Bureau, 2023 ACS
Explore
- Housing % of Units Built Since 2010, by Zip Code (ZCTA5) — Florida
- Housing % of Units Built Since 2010, by Zip Code (ZCTA5) — Nebraska
- Housing Owner-Occupied % of Units, by Zip Code (ZCTA5) — Nebraska
- % of Households with Broadband Internet, by Zip Code (ZCTA5) — Nebraska
- Population Non-Hispanic American Indian % by Zip Code (ZCTA5) — Nebraska
- Household Average Size by Zip Code (ZCTA5) — Nebraska
- % of Population without Health Insurance, by Zip Code (ZCTA5) — Nebraska
- Housing Median Monthly Rent ($), by Zip Code (ZCTA5) — Nebraska
- Housing Owner-Occupied Median Value ($), by Zip Code (ZCTA5) — Nebraska
- Bachelor's Degree or Higher (% of Over 25) by Zip Code (ZCTA5) — Nebraska
- Housing Median Monthly Rent ($), by County
- Household Average Size by Zip Code (ZCTA5) — Florida
- Married Couple (% of all Households) by Zip Code (ZCTA5) — Florida
- Housing Vacancy Rate by Zip Code (ZCTA5) — Florida
- % of Population on Food Stamps or SNAP (Last 12 Months), by Zip Code (ZCTA5) — New Jersey
- Housing Owner-Occupied Median Value ($), by Zip Code (ZCTA5) — Florida
- % of Population without Health Insurance, by Zip Code (ZCTA5) — Florida
- Housing Median Monthly Rent ($), by Zip Code (ZCTA5) — Florida
- % of Population on Food Stamps or SNAP (Last 12 Months), by Zip Code (ZCTA5) — New York
- % of Households with Broadband Internet, by Zip Code (ZCTA5) — Florida
- Bachelor's Degree or Higher (% of Over 25) by Zip Code (ZCTA5) — Florida
- Housing Owner-Occupied % of Units, by Zip Code (ZCTA5) — Florida
- Population Non-Hispanic Asian % by Zip Code (ZCTA5) — Mississippi
- % of Households with Broadband Internet, by Zip Code (ZCTA5) — Mississippi
- % of Population on Food Stamps or SNAP (Last 12 Months), by Zip Code (ZCTA5) — Mississippi
- Median Age by Zip Code (ZCTA5) — Idaho
- Population Non-Hispanic American Indian % by Zip Code (ZCTA5) — Mississippi
- % of Population without Health Insurance, by Zip Code (ZCTA5) — Mississippi
- Bachelor's Degree or Higher (% of Over 25) by Zip Code (ZCTA5) — Mississippi
- Housing Vacancy Rate by Zip Code (ZCTA5) — Mississippi
- High School Graduate (% of Over 25) by Zip Code (ZCTA5) — Alaska
- High School Graduate (% of Over 25) by Zip Code (ZCTA5) — Nevada
- High School Graduate (% of Over 25) by Zip Code (ZCTA5) — Ohio
- High School Graduate (% of Over 25) by Zip Code (ZCTA5) — New York
- High School Graduate (% of Over 25) by Zip Code (ZCTA5) — Iowa
- High School Graduate (% of Over 25) by Zip Code (ZCTA5) — Utah
- High School Graduate (% of Over 25) by Zip Code (ZCTA5) — Colorado
- High School Graduate (% of Over 25) by Zip Code (ZCTA5) — Texas
- High School Graduate (% of Over 25) by Zip Code (ZCTA5) — Oregon
- High School Graduate (% of Over 25) by Zip Code (ZCTA5) — Idaho