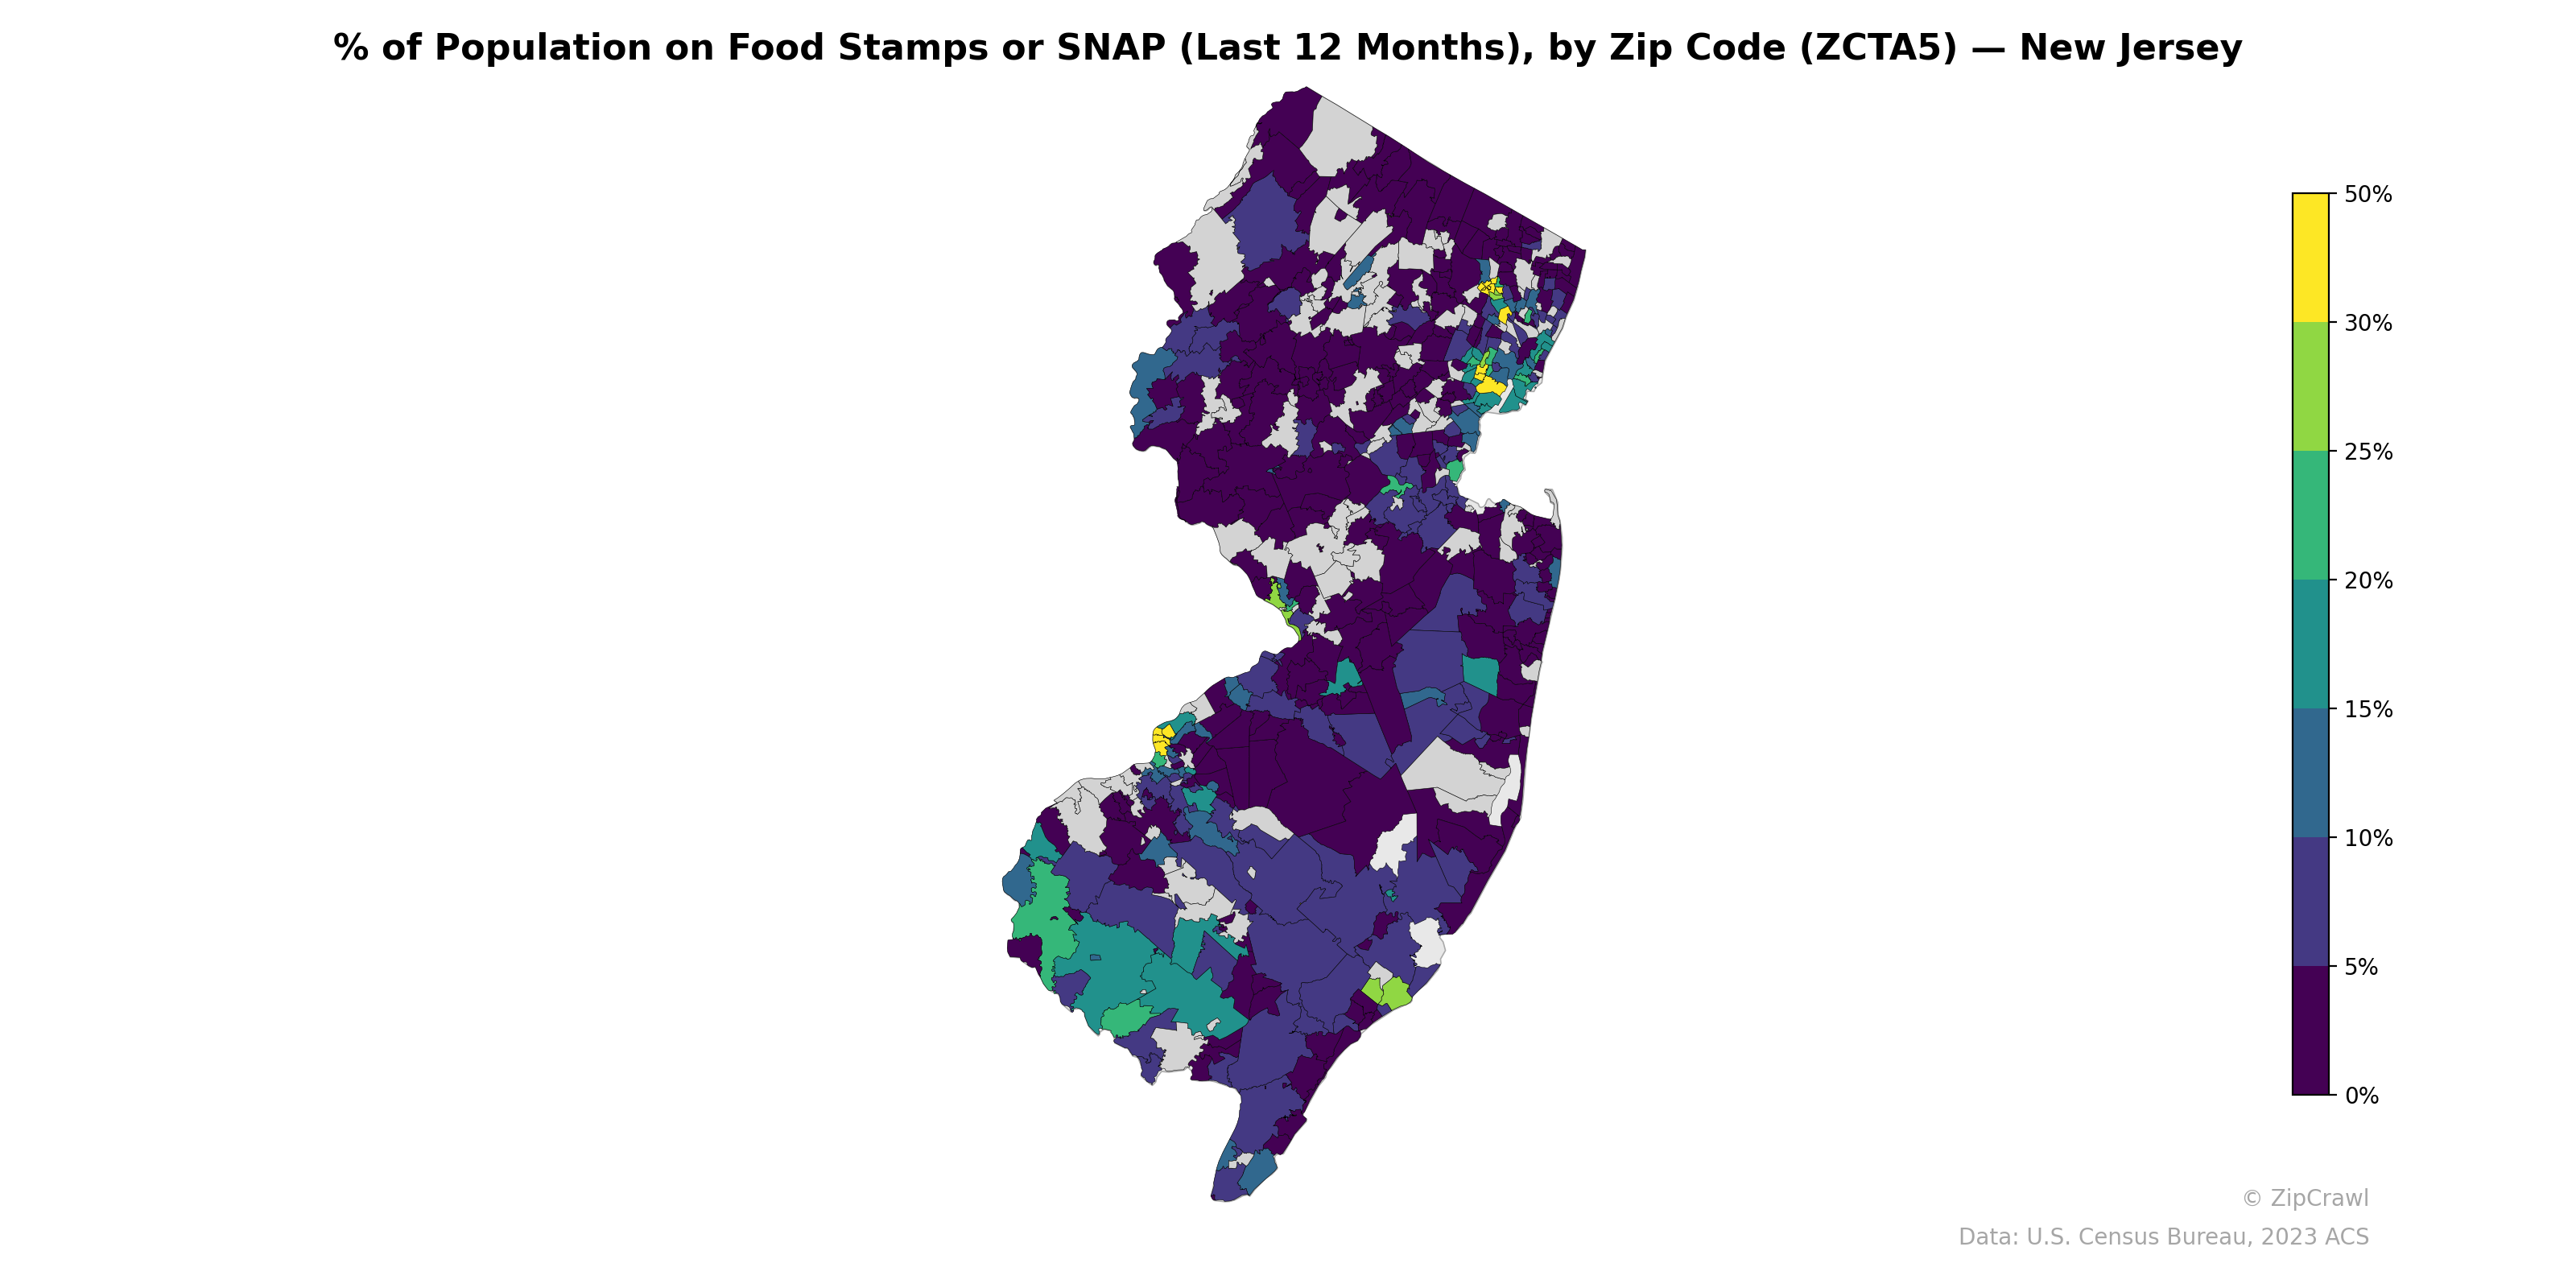
NOTE: Gray indicates insufficient data or a suppressed estimate.
Urban centers such as Newark, Trenton, Camden, and Atlantic City display the highest SNAP participation rates, with several zip codes exceeding 30–50%, appearing as bright yellow-green clusters against the predominantly dark backdrop of the state. Suburban and exurban areas in Morris, Somerset, Hunterdon, and western Monmouth counties consistently register below 5%, forming a broad corridor of very low food assistance utilization through north-central New Jersey. The southern coastal and Pine Barrens regions show moderate variability, with pockets of elevated SNAP usage in Cumberland and Salem counties contrasting sharply with affluent shore communities nearby.
Data: U.S. Census Bureau, 2023 ACS
Explore
- Household Average Size by Zip Code (ZCTA5) — New York Metro
- High School Graduate (% of Over 25) by Zip Code (ZCTA5) — Washington D.C. Metro
- Population Non-Hispanic Asian % by Zip Code (ZCTA5) — New Jersey
- Population Non-Hispanic American Indian % by Zip Code (ZCTA5) — Washington D.C. Metro
- U.S. Citizens (% of Population Over 18) by Zip Code (ZCTA5) — Washington D.C. Metro
- Household Median Income by Zip Code (ZCTA5) — Washington D.C. Metro
- Population Non-Hispanic White % by Zip Code (ZCTA5) — Washington D.C. Metro
- Population Non-Hispanic Black % by Zip Code (ZCTA5) — Washington D.C. Metro
- Population Hispanic % by Zip Code (ZCTA5) — Washington D.C. Metro
- Median Age by Zip Code (ZCTA5) — Washington D.C. Metro
- High School Graduate (% of Over 25) by Zip Code (ZCTA5) — Nebraska
- Population Non-Hispanic White % by County
- % of Population without Health Insurance, by Zip Code (ZCTA5) — New York Metro
- Population Non-Hispanic Asian % by Zip Code (ZCTA5) — New York Metro
- Housing Vacancy Rate by Zip Code (ZCTA5) — New York Metro
- Housing Owner-Occupied Median Value ($), by Zip Code (ZCTA5) — New York Metro
- % of Households with Broadband Internet, by Zip Code (ZCTA5) — New York Metro
- Housing Median Monthly Rent ($), by Zip Code (ZCTA5) — New York Metro
- Housing % of Units Built Since 2010, by Zip Code (ZCTA5) — New York Metro
- Married Couple (% of all Households) by Zip Code (ZCTA5) — New York Metro
- Household Average Size by Zip Code (ZCTA5) — North Carolina
- Housing Median Monthly Rent ($), by Zip Code (ZCTA5) — North Carolina
- Married Couple (% of all Households) by Zip Code (ZCTA5) — North Carolina
- % of Households with Broadband Internet, by Zip Code (ZCTA5) — North Carolina
- Bachelor's Degree or Higher (% of Over 25) by Zip Code (ZCTA5) — North Carolina
- % of Population without Health Insurance, by Zip Code (ZCTA5) — North Carolina
- High School Graduate (% of Over 25) by Zip Code (ZCTA5) — Wisconsin
- Housing Owner-Occupied Median Value ($), by Zip Code (ZCTA5) — North Carolina
- Housing % of Units Built Since 2010, by Zip Code (ZCTA5) — North Carolina
- Population Non-Hispanic American Indian % by Zip Code (ZCTA5) — North Carolina
- % of Population on Food Stamps or SNAP (Last 12 Months), by Zip Code (ZCTA5) — New York
- % of Population on Food Stamps or SNAP (Last 12 Months), by Zip Code (ZCTA5) — New Mexico
- % of Population on Food Stamps or SNAP (Last 12 Months), by Zip Code (ZCTA5) — Nevada
- % of Population on Food Stamps or SNAP (Last 12 Months), by Zip Code (ZCTA5) — New Hampshire
- % of Population on Food Stamps or SNAP (Last 12 Months), by Zip Code (ZCTA5) — Ohio
- % of Population on Food Stamps or SNAP (Last 12 Months), by Zip Code (ZCTA5) — Montana
- % of Population on Food Stamps or SNAP (Last 12 Months), by Zip Code (ZCTA5) — Oregon
- % of Population on Food Stamps or SNAP (Last 12 Months), by Zip Code (ZCTA5) — Nebraska
- % of Population on Food Stamps or SNAP (Last 12 Months), by Zip Code (ZCTA5) — Utah
- % of Population on Food Stamps or SNAP (Last 12 Months), by Zip Code (ZCTA5) — Iowa