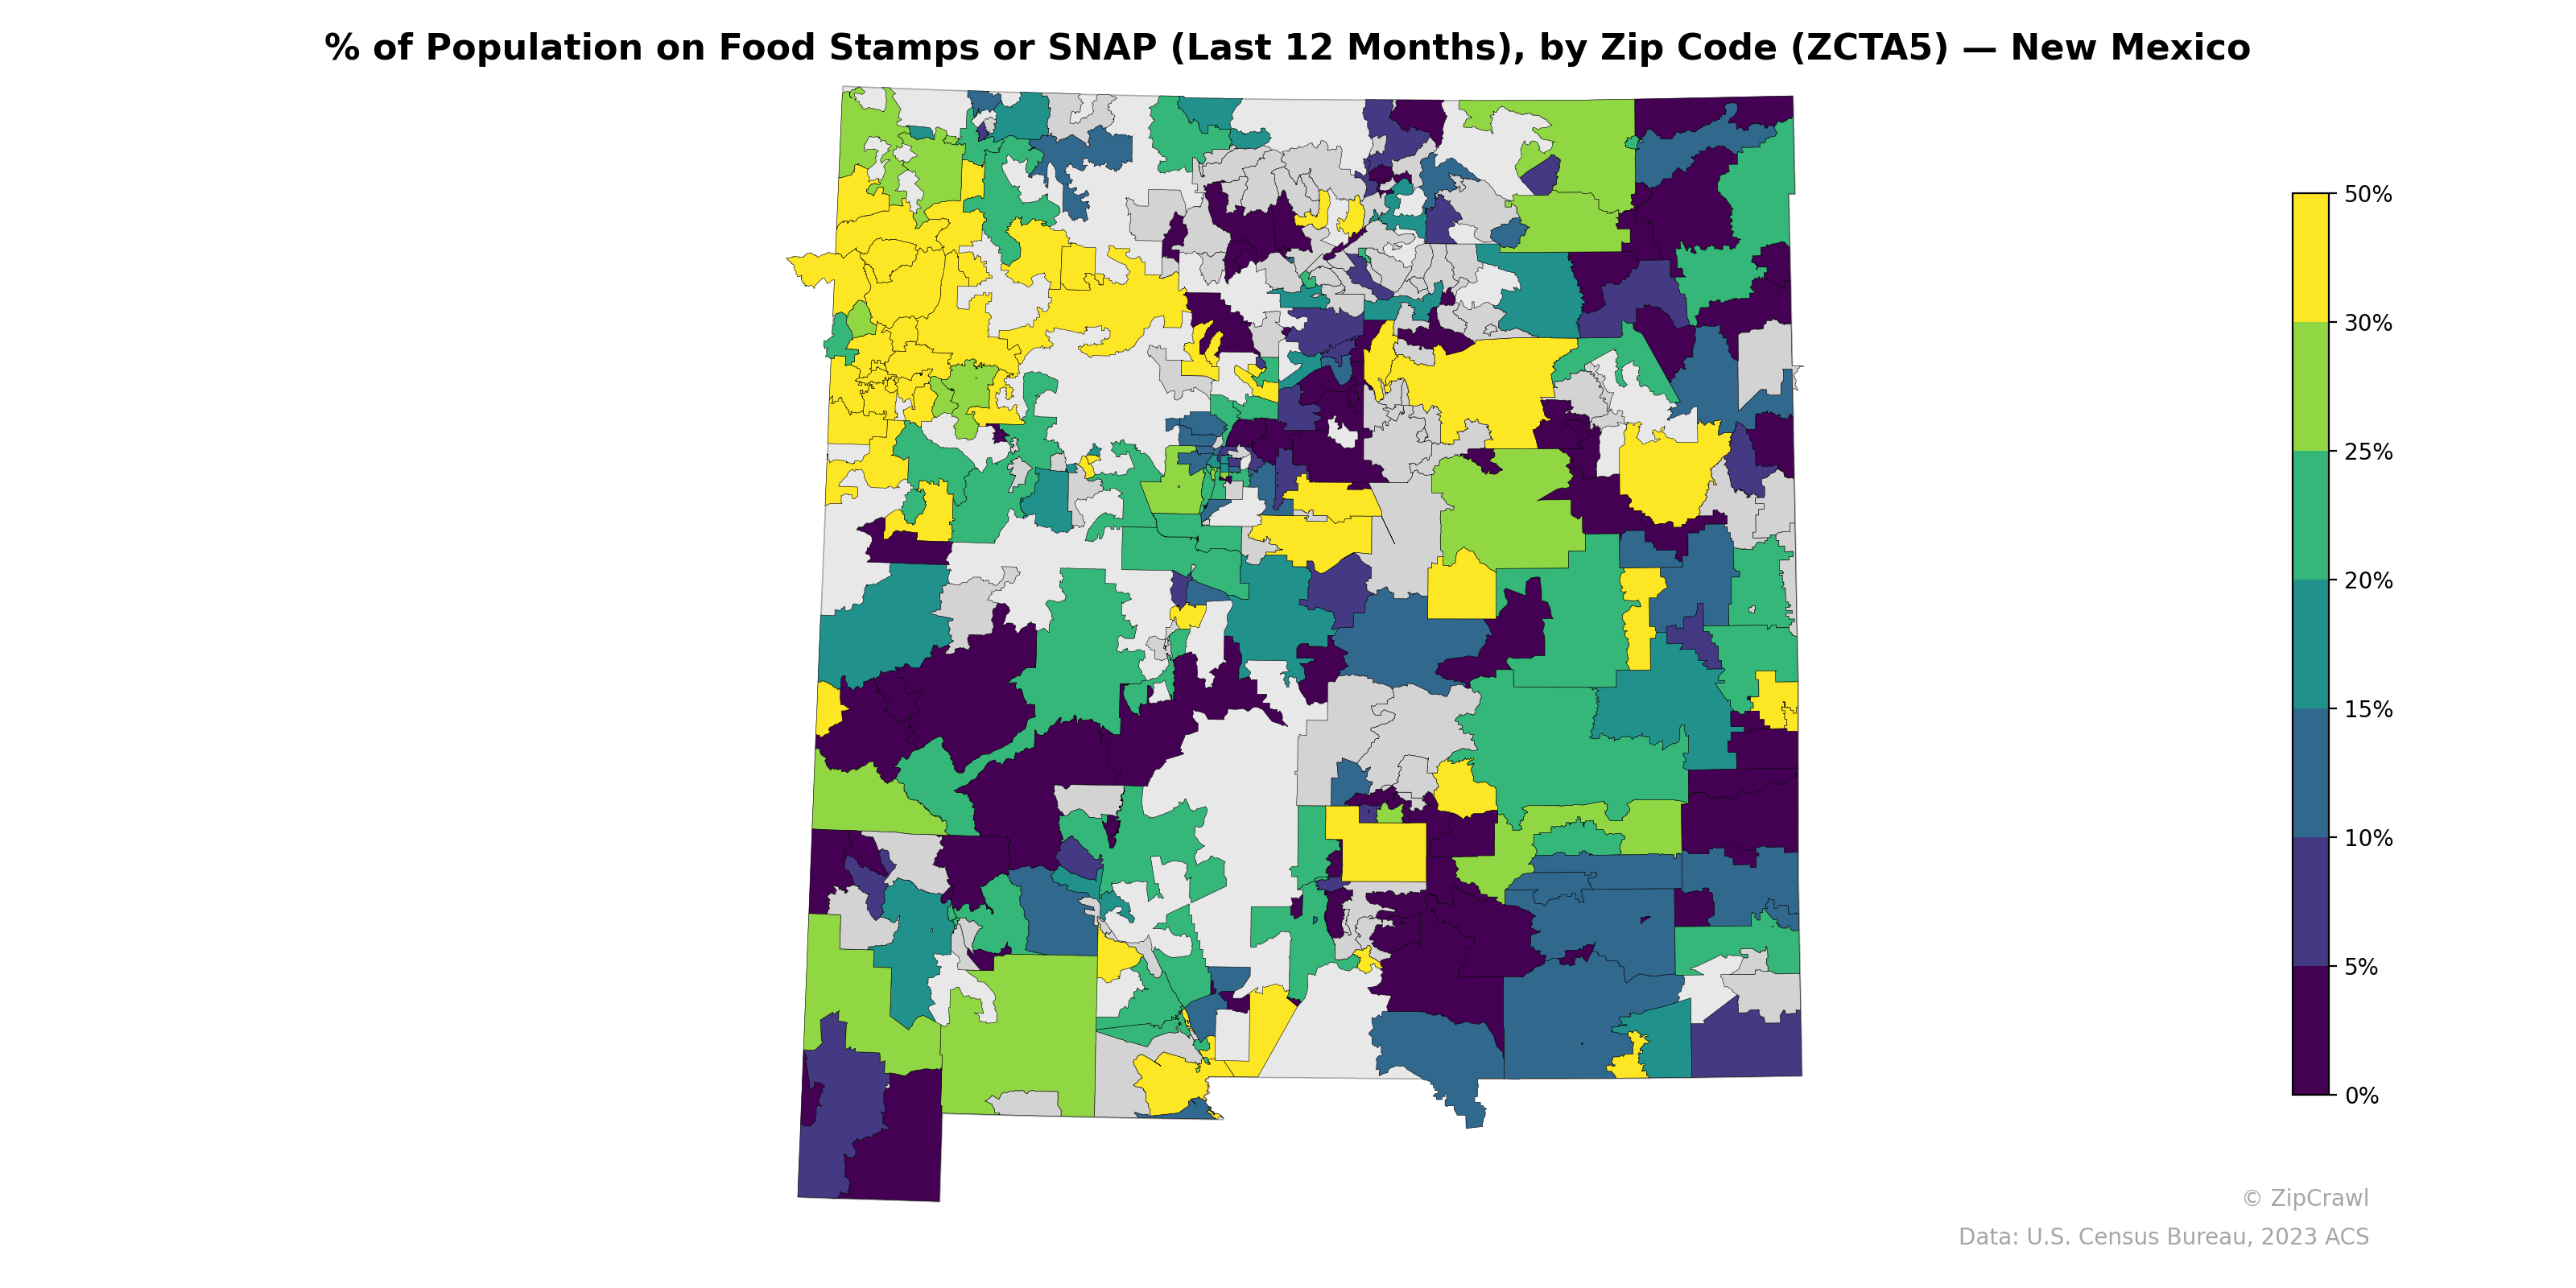
NOTE: Gray indicates insufficient data or a suppressed estimate.
Zip codes in the northwestern quadrant of New Mexico—particularly those overlapping with tribal lands in the Navajo Nation and surrounding pueblos—display some of the highest SNAP participation rates, frequently exceeding 30–40%, while adjacent areas in the north-central region near Santa Fe and Los Alamos show markedly lower rates below 10%. The southern border region exhibits a patchwork pattern, with several zip codes near Las Cruces and the Doña Ana County corridor reaching 25–35% alongside neighboring areas with substantially lower enrollment. Urban zip codes in the Albuquerque metro area show significant intra-city variation, with some central and south-side codes at 20–30% contrasting sharply with near-zero rates in the northeast heights and Rio Rancho suburbs.
Data: U.S. Census Bureau, 2023 ACS
Explore
- Housing Median Monthly Rent ($), by Zip Code (ZCTA5) — Florida
- Population Hispanic % by Zip Code (ZCTA5) — Nebraska
- Population Non-Hispanic White % by Zip Code (ZCTA5) — Nebraska
- Population Non-Hispanic Asian % by Zip Code (ZCTA5) — New Mexico
- U.S. Citizens (% of Population Over 18) by Zip Code (ZCTA5) — Nebraska
- Population Non-Hispanic Black % by Zip Code (ZCTA5) — Nebraska
- Housing Vacancy Rate by Zip Code (ZCTA5) — New Mexico
- Household Median Income by Zip Code (ZCTA5) — Nebraska
- Median Age by Zip Code (ZCTA5) — Nebraska
- Married Couple (% of all Households) by Zip Code (ZCTA5) — New Mexico
- Housing Median Monthly Rent ($), by County
- Married Couple (% of all Households) by Zip Code (ZCTA5) — Florida
- Housing Vacancy Rate by Zip Code (ZCTA5) — Florida
- Housing Owner-Occupied % of Units, by Zip Code (ZCTA5) — New York
- Housing Owner-Occupied % of Units, by Zip Code (ZCTA5) — New Jersey
- Housing Owner-Occupied Median Value ($), by Zip Code (ZCTA5) — Florida
- Housing Owner-Occupied % of Units, by Zip Code (ZCTA5) — Florida
- Housing % of Units Built Since 2010, by Zip Code (ZCTA5) — Florida
- Bachelor's Degree or Higher (% of Over 25) by Zip Code (ZCTA5) — Florida
- % of Population without Health Insurance, by Zip Code (ZCTA5) — Florida
- % of Households with Broadband Internet, by Zip Code (ZCTA5) — Florida
- Household Average Size by Zip Code (ZCTA5) — Florida
- Housing Vacancy Rate by Zip Code (ZCTA5) — Mississippi
- Bachelor's Degree or Higher (% of Over 25) by Zip Code (ZCTA5) — Mississippi
- Population Non-Hispanic Asian % by Zip Code (ZCTA5) — Mississippi
- % of Households with Broadband Internet, by Zip Code (ZCTA5) — Mississippi
- Population Non-Hispanic American Indian % by Zip Code (ZCTA5) — Mississippi
- Median Age by Zip Code (ZCTA5) — Idaho
- High School Graduate (% of Over 25) by Zip Code (ZCTA5) — Mississippi
- Married Couple (% of all Households) by Zip Code (ZCTA5) — Mississippi
- % of Population on Food Stamps or SNAP (Last 12 Months), by Zip Code (ZCTA5) — New York
- % of Population on Food Stamps or SNAP (Last 12 Months), by Zip Code (ZCTA5) — New Jersey
- % of Population on Food Stamps or SNAP (Last 12 Months), by Zip Code (ZCTA5) — Nevada
- % of Population on Food Stamps or SNAP (Last 12 Months), by Zip Code (ZCTA5) — New York Metro
- % of Population on Food Stamps or SNAP (Last 12 Months), by Zip Code (ZCTA5) — New Hampshire
- % of Population on Food Stamps or SNAP (Last 12 Months), by Zip Code (ZCTA5) — Oregon
- % of Population on Food Stamps or SNAP (Last 12 Months), by Zip Code (ZCTA5) — Ohio
- % of Population on Food Stamps or SNAP (Last 12 Months), by Zip Code (ZCTA5) — Montana
- % of Population on Food Stamps or SNAP (Last 12 Months), by Zip Code (ZCTA5) — Nebraska
- % of Population on Food Stamps or SNAP (Last 12 Months), by Zip Code (ZCTA5) — Iowa