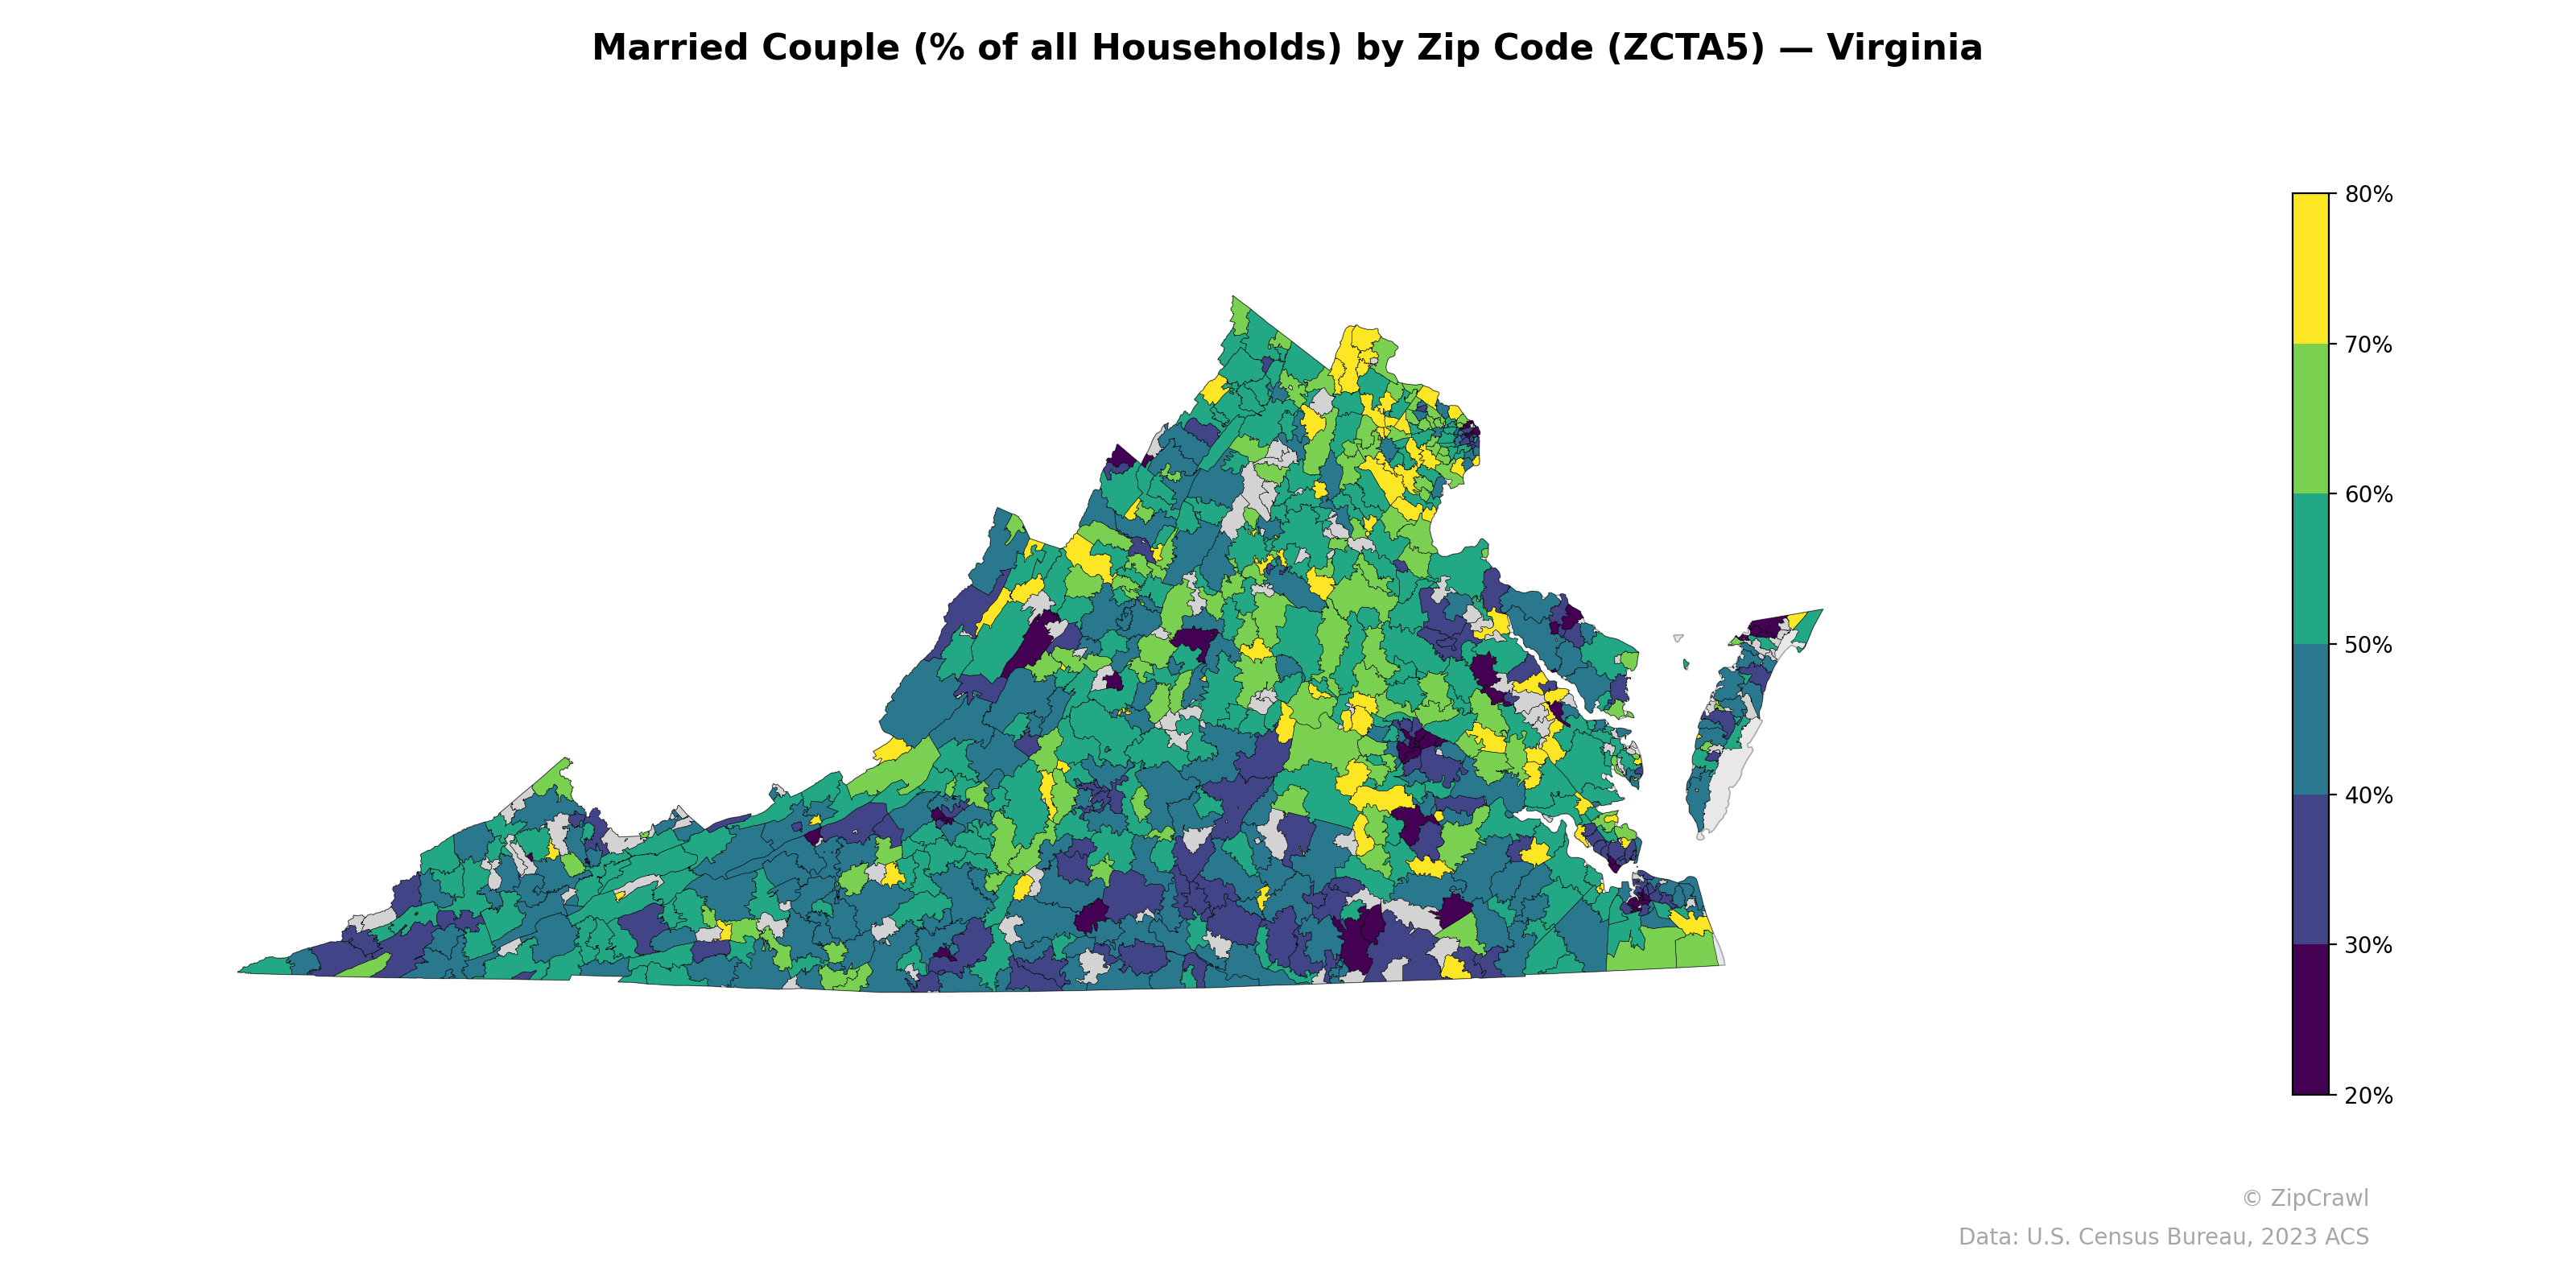
NOTE: Gray indicates insufficient data or a suppressed estimate.
Northern Virginia's outer suburban zip codes—particularly in Loudoun and Prince William counties—display the highest married-couple household rates, frequently exceeding 70%, consistent with family-oriented suburban development patterns. In contrast, independent cities such as Richmond, Norfolk, and Roanoke contain clusters of zip codes falling below 30%, reflecting higher concentrations of single-person households and non-family living arrangements typical of urban cores. The rural southwestern and southside regions exhibit considerable variability, with pockets of both high and low married-couple percentages often adjacent to one another, suggesting localized demographic differences tied to college towns, military installations, or economic conditions.
Data: U.S. Census Bureau, 2023 ACS
Explore
- Population Non-Hispanic White % by Zip Code (ZCTA5) — Los Angeles Metro
- Housing Owner-Occupied Median Value ($), by Zip Code (ZCTA5) — Virginia
- Housing % of Units Built Since 2010, by Zip Code (ZCTA5) — Virginia
- Bachelor's Degree or Higher (% of Over 25) by Zip Code (ZCTA5) — Virginia
- Housing Owner-Occupied % of Units, by Zip Code (ZCTA5) — Virginia
- Household Average Size by Zip Code (ZCTA5) — Virginia
- % of Households with Broadband Internet, by Zip Code (ZCTA5) — Virginia
- Housing Median Monthly Rent ($), by Zip Code (ZCTA5) — Virginia
- % of Population without Health Insurance, by Zip Code (ZCTA5) — Virginia
- Housing Vacancy Rate by Zip Code (ZCTA5) — Virginia
- Population Hispanic % by Zip Code (ZCTA5) — Maine
- Population Hispanic % by County
- High School Graduate (% of Over 25) by Zip Code (ZCTA5) — Los Angeles Metro
- Population Non-Hispanic American Indian % by Zip Code (ZCTA5) — Los Angeles Metro
- Population Hispanic % by Zip Code (ZCTA5) — Los Angeles Metro
- Population Non-Hispanic Black % by Zip Code (ZCTA5) — Los Angeles Metro
- % of Population on Food Stamps or SNAP (Last 12 Months), by Zip Code (ZCTA5) — New York Metro
- Median Age by Zip Code (ZCTA5) — Los Angeles Metro
- U.S. Citizens (% of Population Over 18) by Zip Code (ZCTA5) — Los Angeles Metro
- Household Median Income by Zip Code (ZCTA5) — Los Angeles Metro
- Population Non-Hispanic American Indian % by Zip Code (ZCTA5) — Virginia
- Population Hispanic % by Zip Code (ZCTA5) — Virginia
- Population Non-Hispanic White % by Zip Code (ZCTA5) — Virginia
- Population Non-Hispanic Black % by Zip Code (ZCTA5) — Virginia
- U.S. Citizens (% of Population Over 18) by Zip Code (ZCTA5) — Virginia
- High School Graduate (% of Over 25) by Zip Code (ZCTA5) — Virginia
- Population Hispanic % by Zip Code (ZCTA5) — Wisconsin
- Household Median Income by Zip Code (ZCTA5) — Virginia
- Bachelor's Degree or Higher (% of Over 25) by Zip Code (ZCTA5) — Washington
- Median Age by Zip Code (ZCTA5) — Virginia
- Married Couple (% of all Households) by Zip Code (ZCTA5) — West Virginia
- Married Couple (% of all Households) by Zip Code (ZCTA5) — Georgia
- Married Couple (% of all Households) by Zip Code (ZCTA5) — Maine
- Married Couple (% of all Households) by Zip Code (ZCTA5) — Ohio
- Married Couple (% of all Households) by Zip Code (ZCTA5) — Iowa
- Married Couple (% of all Households) by Zip Code (ZCTA5) — Alaska
- Married Couple (% of all Households) by Zip Code (ZCTA5) — Utah
- Married Couple (% of all Households) by Zip Code (ZCTA5) — California
- Married Couple (% of all Households) by Zip Code (ZCTA5) — Vermont
- Married Couple (% of all Households) by Zip Code (ZCTA5) — Alabama