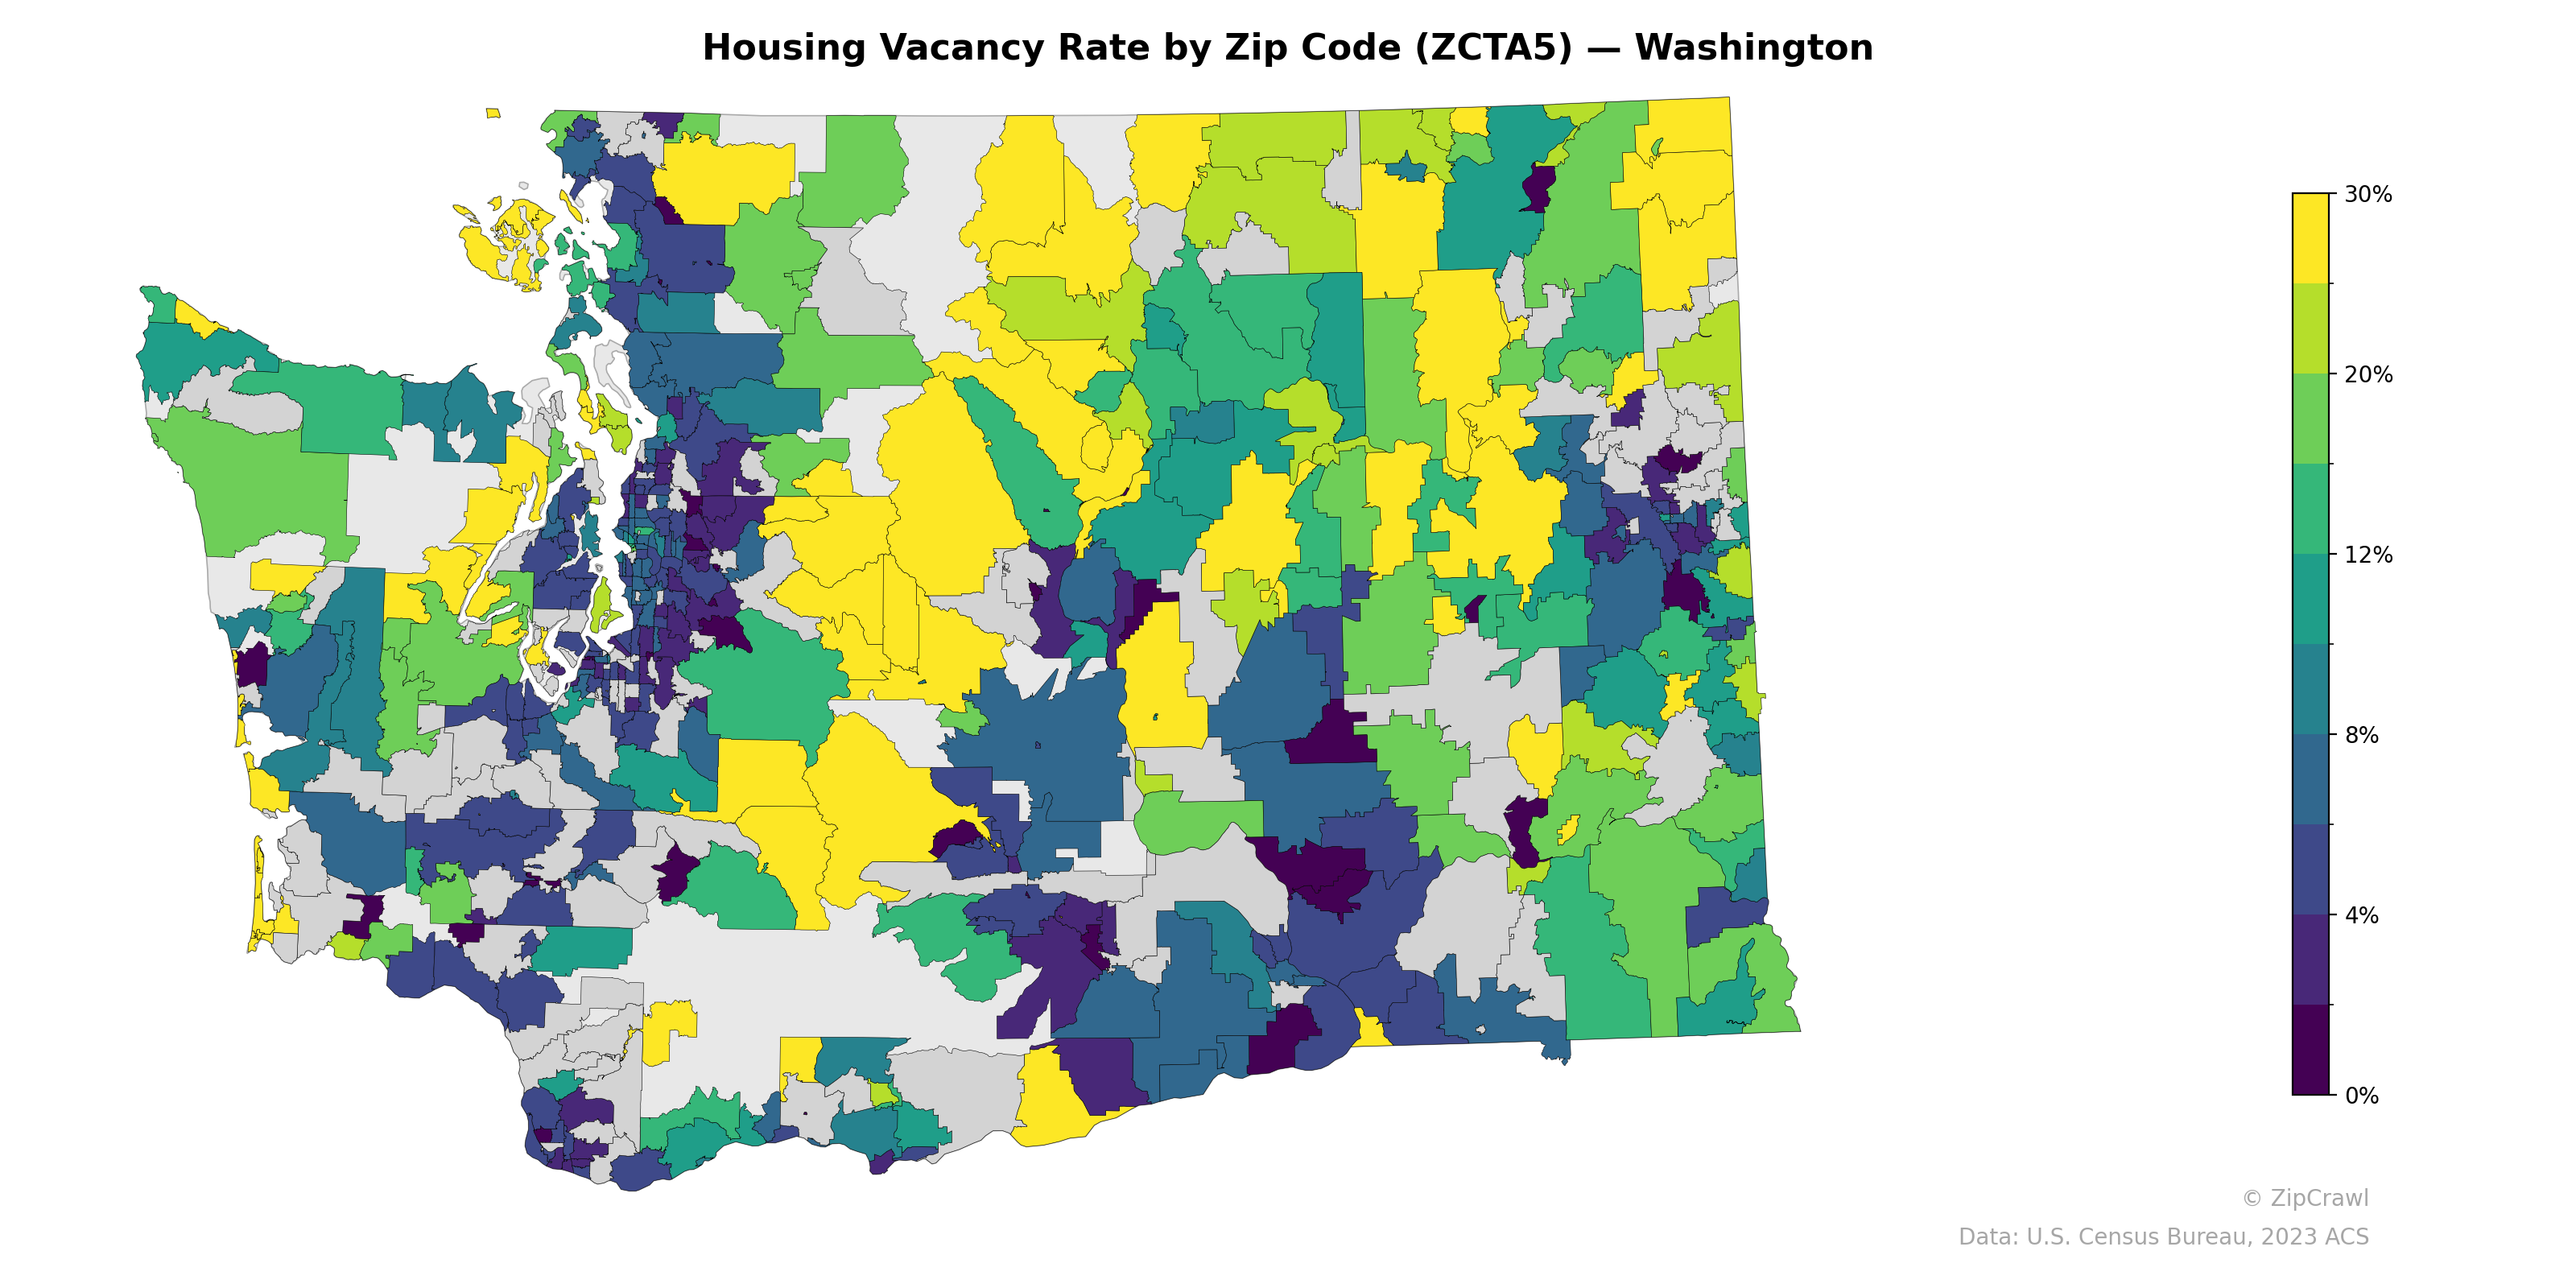
NOTE: Gray indicates insufficient data or a suppressed estimate.
Housing vacancy rates across Washington state exhibit a striking urban-rural divide, with the Seattle-Tacoma metropolitan corridor and surrounding Puget Sound zip codes displaying notably low vacancy rates (dark blue/teal, often below 4%), while rural areas in the north-central and northeastern portions of the state show substantially higher rates exceeding 20%. Coastal zip codes along the Pacific display an uneven pattern, with some areas registering elevated vacancy likely tied to seasonal or vacation housing stock. The central agricultural regions around the Columbia Basin show a mixed patchwork of moderate-to-high vacancy (yellow and green tones, 12–20%), contrasting with pockets of very low vacancy near population centers like the Tri-Cities and Spokane metro areas.
Data: U.S. Census Bureau, 2023 ACS
Explore
- Population Non-Hispanic Black % by Zip Code (ZCTA5) — Los Angeles Metro
- Household Average Size by Zip Code (ZCTA5) — Washington
- Bachelor's Degree or Higher (% of Over 25) by Zip Code (ZCTA5) — Washington
- Housing Owner-Occupied Median Value ($), by Zip Code (ZCTA5) — Washington
- Housing % of Units Built Since 2010, by Zip Code (ZCTA5) — Washington
- % of Population without Health Insurance, by Zip Code (ZCTA5) — Washington
- Housing Median Monthly Rent ($), by Zip Code (ZCTA5) — Washington
- Housing Owner-Occupied % of Units, by Zip Code (ZCTA5) — Washington
- Married Couple (% of all Households) by Zip Code (ZCTA5) — Washington
- % of Households with Broadband Internet, by Zip Code (ZCTA5) — Washington
- Population Non-Hispanic Black % by Zip Code (ZCTA5) — Montana
- Population Hispanic % by County
- High School Graduate (% of Over 25) by Zip Code (ZCTA5) — Los Angeles Metro
- Population Non-Hispanic American Indian % by Zip Code (ZCTA5) — Los Angeles Metro
- Median Age by Zip Code (ZCTA5) — Los Angeles Metro
- Population Hispanic % by Zip Code (ZCTA5) — Los Angeles Metro
- % of Population on Food Stamps or SNAP (Last 12 Months), by Zip Code (ZCTA5) — New York Metro
- U.S. Citizens (% of Population Over 18) by Zip Code (ZCTA5) — Los Angeles Metro
- Household Median Income by Zip Code (ZCTA5) — Los Angeles Metro
- Population Non-Hispanic White % by Zip Code (ZCTA5) — Los Angeles Metro
- Housing % of Units Built Since 2010, by Zip Code (ZCTA5) — Virginia
- Housing Owner-Occupied Median Value ($), by Zip Code (ZCTA5) — Virginia
- Household Average Size by Zip Code (ZCTA5) — Virginia
- High School Graduate (% of Over 25) by Zip Code (ZCTA5) — Virginia
- Population Non-Hispanic American Indian % by Zip Code (ZCTA5) — Virginia
- Bachelor's Degree or Higher (% of Over 25) by Zip Code (ZCTA5) — Virginia
- % of Population without Health Insurance, by Zip Code (ZCTA5) — Virginia
- Housing Owner-Occupied % of Units, by Zip Code (ZCTA5) — Virginia
- Housing Median Monthly Rent ($), by Zip Code (ZCTA5) — Virginia
- Population Hispanic % by Zip Code (ZCTA5) — Virginia
- Housing Vacancy Rate by Zip Code (ZCTA5) — Washington D.C.
- Housing Vacancy Rate by Zip Code (ZCTA5) — Washington D.C. Metro
- Housing Vacancy Rate by Zip Code (ZCTA5) — Wyoming
- Housing Vacancy Rate by Zip Code (ZCTA5) — Oregon
- Housing Vacancy Rate by Zip Code (ZCTA5) — Utah
- Housing Vacancy Rate by Zip Code (ZCTA5) — Ohio
- Housing Vacancy Rate by Zip Code (ZCTA5) — Iowa
- Housing Vacancy Rate by Zip Code (ZCTA5) — Houston Metro
- Housing Vacancy Rate by Zip Code (ZCTA5) — Idaho
- Housing Vacancy Rate by Zip Code (ZCTA5) — Texas