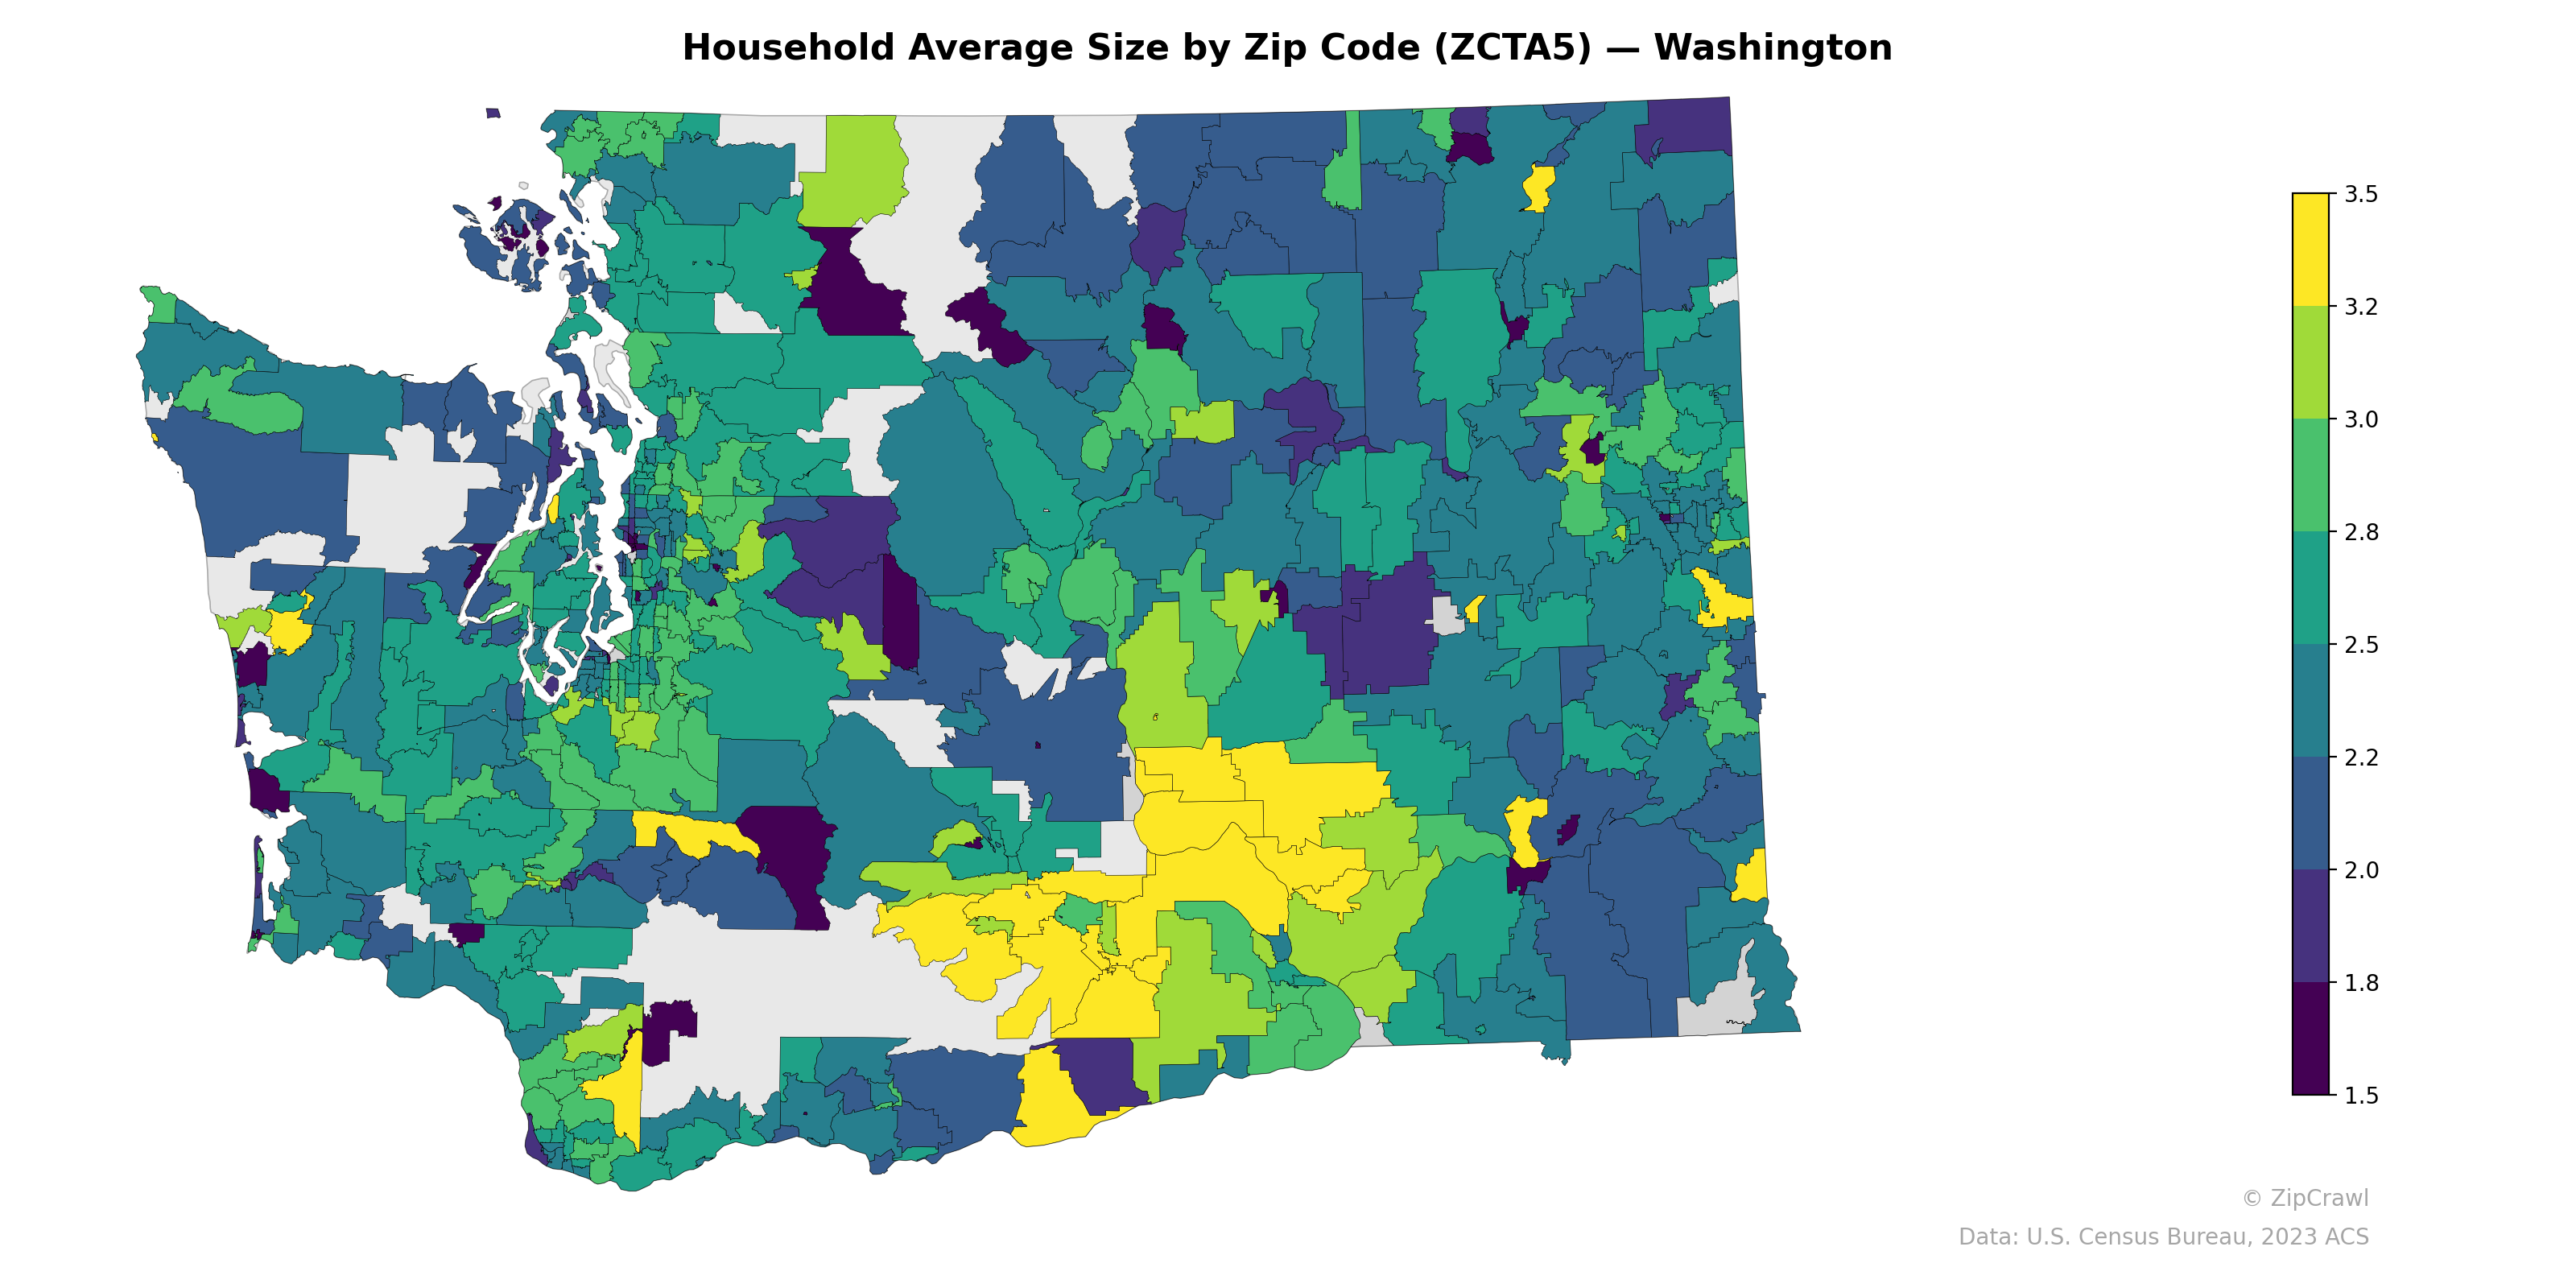
NOTE: Gray indicates insufficient data or a suppressed estimate.
The south-central region of Washington—encompassing the Yakima Valley and portions of the Columbia Basin—displays consistently elevated household sizes (3.0–3.5+), likely reflecting the area's larger agricultural families and Hispanic demographic concentrations. In contrast, urban cores around Seattle, Bellingham, and Olympia exhibit notably smaller average household sizes (1.5–2.2), consistent with higher concentrations of single-person households and smaller rental units. The eastern half of the state generally trends toward moderate household sizes (2.4–2.8), with scattered pockets of larger households near communities such as Moses Lake and the Tri-Cities area.
Data: U.S. Census Bureau, 2023 ACS
Explore
- Population Non-Hispanic Black % by Zip Code (ZCTA5) — Los Angeles Metro
- Married Couple (% of all Households) by Zip Code (ZCTA5) — Washington
- Bachelor's Degree or Higher (% of Over 25) by Zip Code (ZCTA5) — Washington
- Housing Owner-Occupied Median Value ($), by Zip Code (ZCTA5) — Washington
- Housing % of Units Built Since 2010, by Zip Code (ZCTA5) — Washington
- % of Population without Health Insurance, by Zip Code (ZCTA5) — Washington
- Housing Median Monthly Rent ($), by Zip Code (ZCTA5) — Washington
- Housing Owner-Occupied % of Units, by Zip Code (ZCTA5) — Washington
- Housing Vacancy Rate by Zip Code (ZCTA5) — Washington
- % of Households with Broadband Internet, by Zip Code (ZCTA5) — Washington
- Population Non-Hispanic White % by Zip Code (ZCTA5) — Montana
- Population Hispanic % by County
- High School Graduate (% of Over 25) by Zip Code (ZCTA5) — Los Angeles Metro
- Population Non-Hispanic American Indian % by Zip Code (ZCTA5) — Los Angeles Metro
- Median Age by Zip Code (ZCTA5) — Los Angeles Metro
- Population Hispanic % by Zip Code (ZCTA5) — Los Angeles Metro
- % of Population on Food Stamps or SNAP (Last 12 Months), by Zip Code (ZCTA5) — New York Metro
- U.S. Citizens (% of Population Over 18) by Zip Code (ZCTA5) — Los Angeles Metro
- Household Median Income by Zip Code (ZCTA5) — Los Angeles Metro
- Population Non-Hispanic White % by Zip Code (ZCTA5) — Los Angeles Metro
- Housing % of Units Built Since 2010, by Zip Code (ZCTA5) — Virginia
- Housing Owner-Occupied Median Value ($), by Zip Code (ZCTA5) — Virginia
- Married Couple (% of all Households) by Zip Code (ZCTA5) — Virginia
- High School Graduate (% of Over 25) by Zip Code (ZCTA5) — Virginia
- Population Non-Hispanic American Indian % by Zip Code (ZCTA5) — Virginia
- Bachelor's Degree or Higher (% of Over 25) by Zip Code (ZCTA5) — Virginia
- % of Population without Health Insurance, by Zip Code (ZCTA5) — Virginia
- Housing Owner-Occupied % of Units, by Zip Code (ZCTA5) — Virginia
- Housing Median Monthly Rent ($), by Zip Code (ZCTA5) — Virginia
- Population Hispanic % by Zip Code (ZCTA5) — Virginia
- Household Average Size by Zip Code (ZCTA5) — Washington D.C.
- Household Average Size by Zip Code (ZCTA5) — Washington D.C. Metro
- Household Average Size by Zip Code (ZCTA5) — Wyoming
- Household Average Size by Zip Code (ZCTA5) — Oregon
- Household Average Size by Zip Code (ZCTA5) — Utah
- Household Average Size by Zip Code (ZCTA5) — Ohio
- Household Average Size by Zip Code (ZCTA5) — Iowa
- Household Average Size by Zip Code (ZCTA5) — Houston Metro
- Household Average Size by Zip Code (ZCTA5) — Hawaii
- Household Average Size by Zip Code (ZCTA5) — Texas