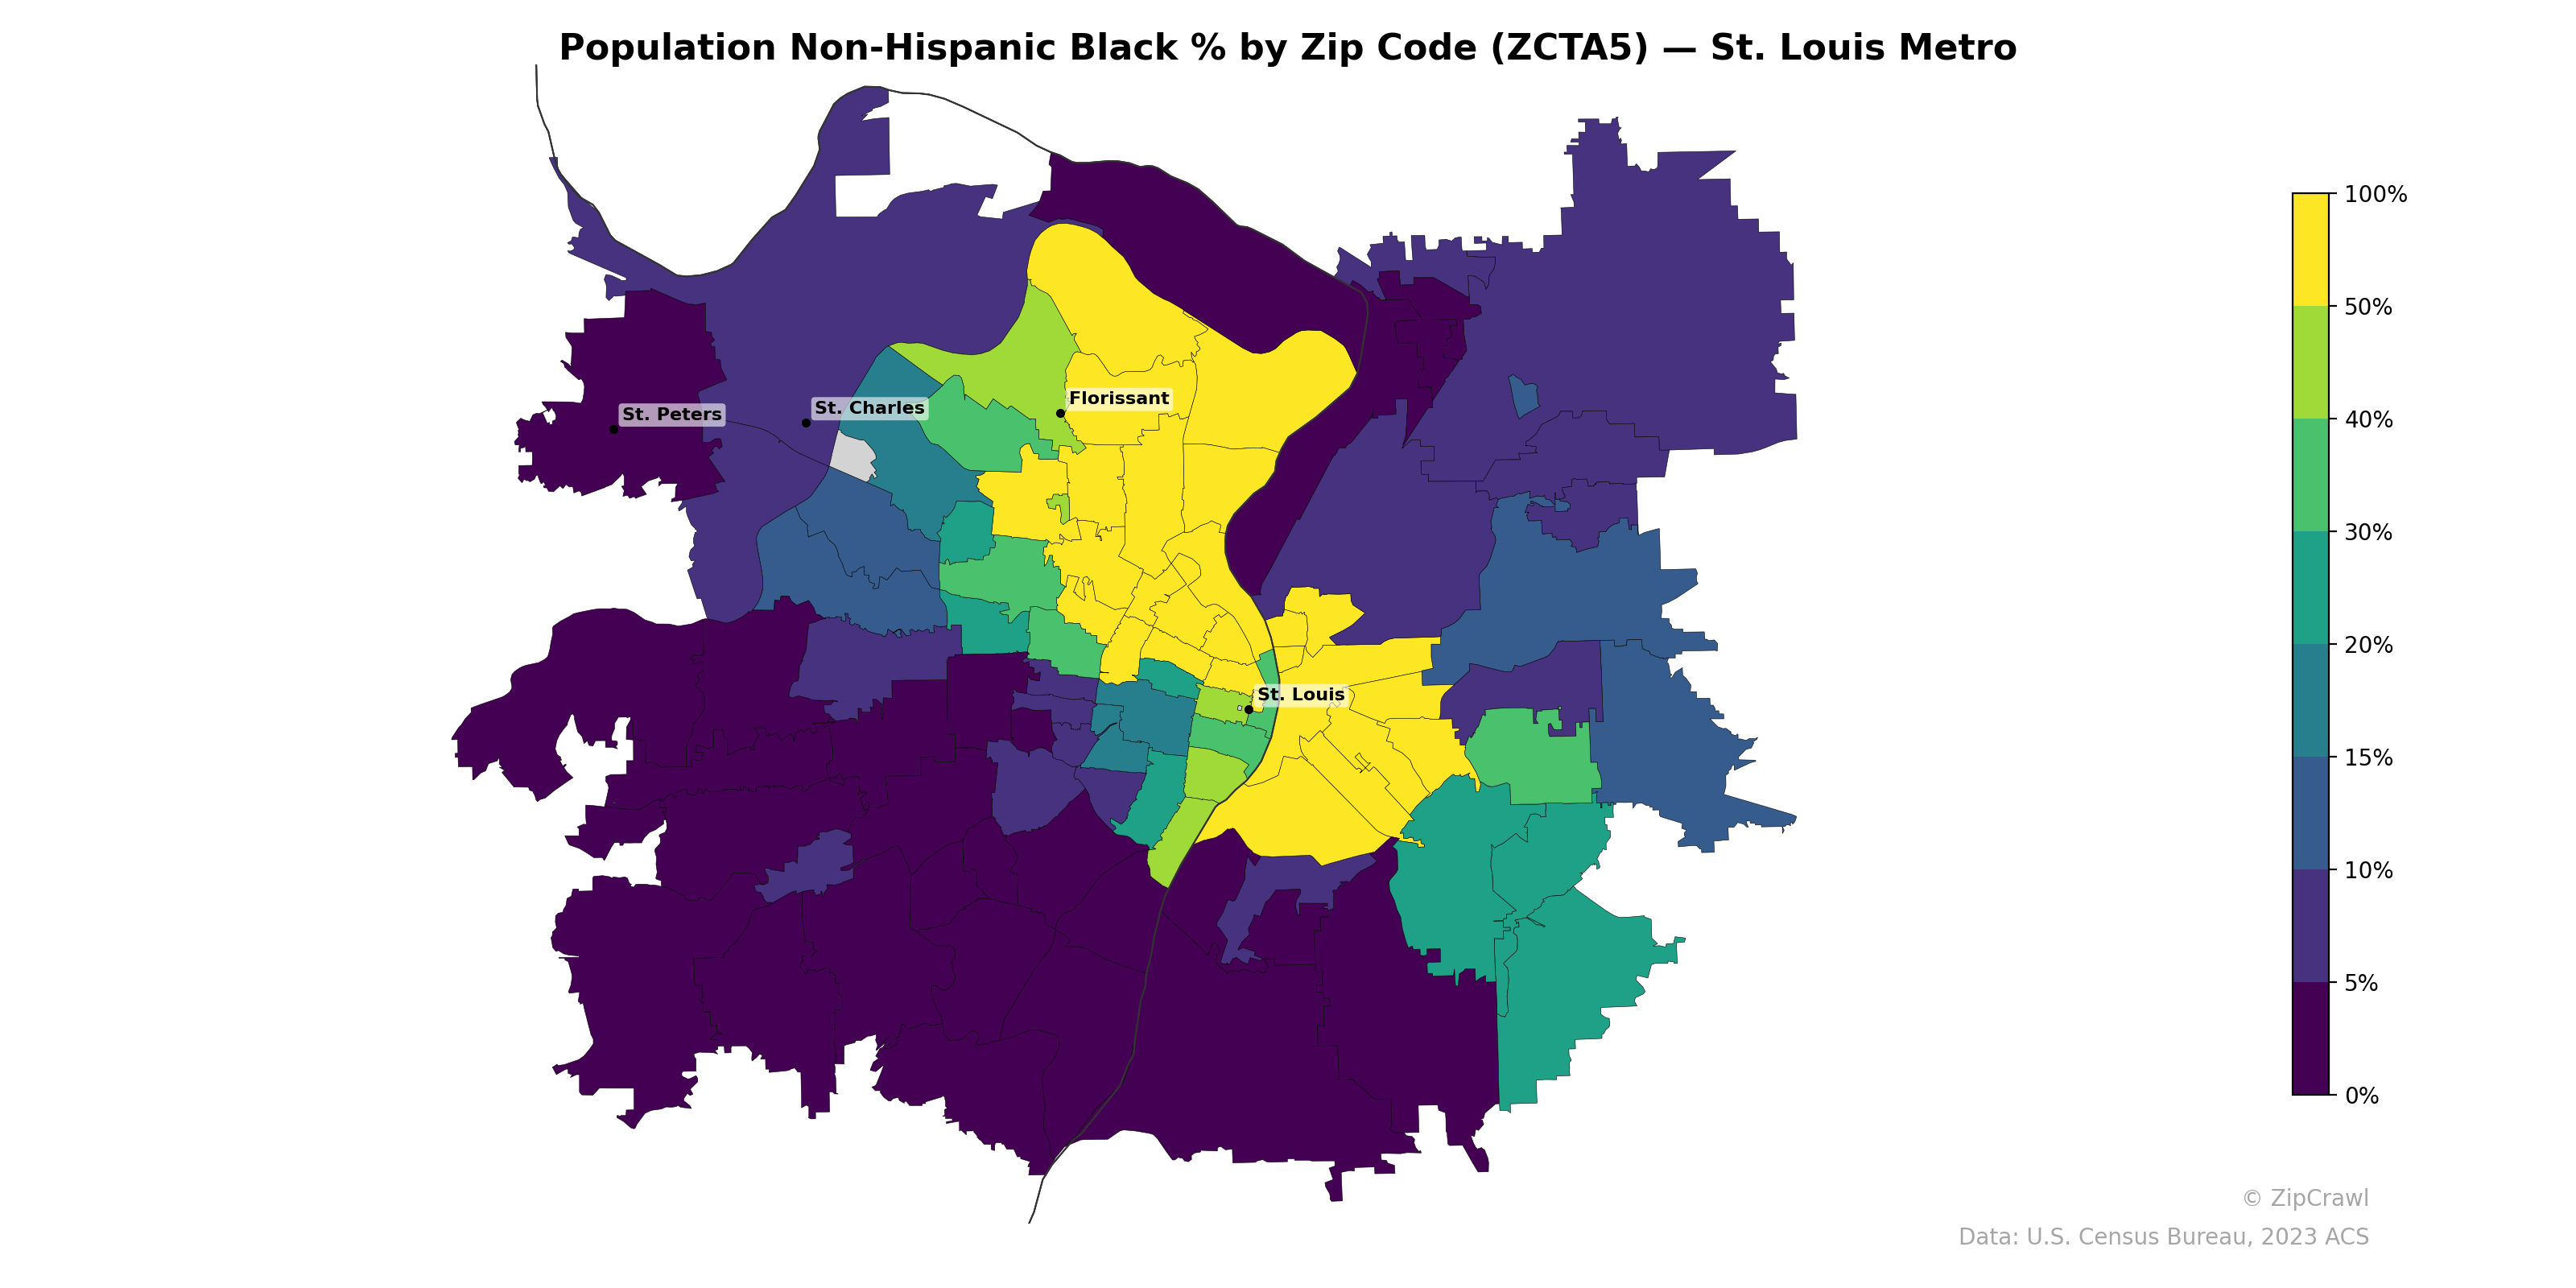
NOTE: Gray indicates insufficient data or a suppressed estimate.
The Non-Hispanic Black population in the St. Louis metro is heavily concentrated in a north-south corridor running from the Florissant area through north St. Louis city, where many zip codes exceed 50% and several approach near-total concentration above 90%. A stark racial boundary is evident, with zip codes to the south and southwest—particularly in the outer suburban ring—dropping sharply to below 5%, reflecting the deeply entrenched patterns of residential segregation that have historically defined the region. St. Charles and St. Peters to the west similarly register very low percentages, generally under 10%, contrasting sharply with the adjacent inner-ring suburbs of north St. Louis County.
Data: U.S. Census Bureau, 2023 ACS
Explore
- U.S. Citizens (% of Population Over 18) by Zip Code (ZCTA5) — Texas
- High School Graduate (% of Over 25) by Zip Code (ZCTA5) — St. Louis Metro
- Household Median Income by Zip Code (ZCTA5) — St. Louis Metro
- Population Non-Hispanic Asian % by Zip Code (ZCTA5) — Baltimore Metro
- Median Age by Zip Code (ZCTA5) — St. Louis Metro
- Population Hispanic % by Zip Code (ZCTA5) — St. Louis Metro
- Population Non-Hispanic White % by Zip Code (ZCTA5) — St. Louis Metro
- Population Non-Hispanic American Indian % by Zip Code (ZCTA5) — St. Louis Metro
- % of Population on Food Stamps or SNAP (Last 12 Months), by Zip Code (ZCTA5) — Baltimore Metro
- U.S. Citizens (% of Population Over 18) by Zip Code (ZCTA5) — St. Louis Metro
- High School Graduate (% of Over 25) by County
- Population Non-Hispanic White % by Zip Code (ZCTA5) — Texas
- Population Non-Hispanic Asian % by Zip Code (ZCTA5) — Chicago Metro
- % of Population on Food Stamps or SNAP (Last 12 Months), by Zip Code (ZCTA5) — Chicago Metro
- Population Hispanic % by Zip Code (ZCTA5) — Texas
- High School Graduate (% of Over 25) by Zip Code (ZCTA5) — Texas
- Population Non-Hispanic American Indian % by Zip Code (ZCTA5) — New York Metro
- Population Non-Hispanic American Indian % by Zip Code (ZCTA5) — Texas
- Median Age by Zip Code (ZCTA5) — Texas
- Household Median Income by Zip Code (ZCTA5) — Texas
- % of Households with Broadband Internet, by Zip Code (ZCTA5) — Baltimore Metro
- High School Graduate (% of Over 25) by Zip Code (ZCTA5) — Baltimore Metro
- % of Population without Health Insurance, by Zip Code (ZCTA5) — Baltimore Metro
- % of Population on Food Stamps or SNAP (Last 12 Months), by Zip Code (ZCTA5) — Charlotte Metro
- Population Non-Hispanic Asian % by Zip Code (ZCTA5) — Charlotte Metro
- U.S. Citizens (% of Population Over 18) by Zip Code (ZCTA5) — Baltimore Metro
- Population Non-Hispanic American Indian % by Zip Code (ZCTA5) — Baltimore Metro
- Housing Median Monthly Rent ($), by Zip Code (ZCTA5) — Minnesota
- Bachelor's Degree or Higher (% of Over 25) by Zip Code (ZCTA5) — Baltimore Metro
- Household Median Income by Zip Code (ZCTA5) — Baltimore Metro
- Population Non-Hispanic Black % by Zip Code (ZCTA5) — Boston Metro
- Population Non-Hispanic Black % by Zip Code (ZCTA5) — Miami Metro
- Population Non-Hispanic Black % by Zip Code (ZCTA5) — Seattle Metro
- Population Non-Hispanic Black % by Zip Code (ZCTA5) — Detroit Metro
- Population Non-Hispanic Black % by Zip Code (ZCTA5) — Houston Metro
- Population Non-Hispanic Black % by Zip Code (ZCTA5) — Tampa Metro
- Population Non-Hispanic Black % by Zip Code (ZCTA5) — Louisiana
- Population Non-Hispanic Black % by Zip Code (ZCTA5) — Dallas Metro
- Population Non-Hispanic Black % by Zip Code (ZCTA5) — Chicago Metro
- Population Non-Hispanic Black % by Zip Code (ZCTA5) — Phoenix Metro