NOTE: Gray indicates insufficient data or a suppressed estimate.
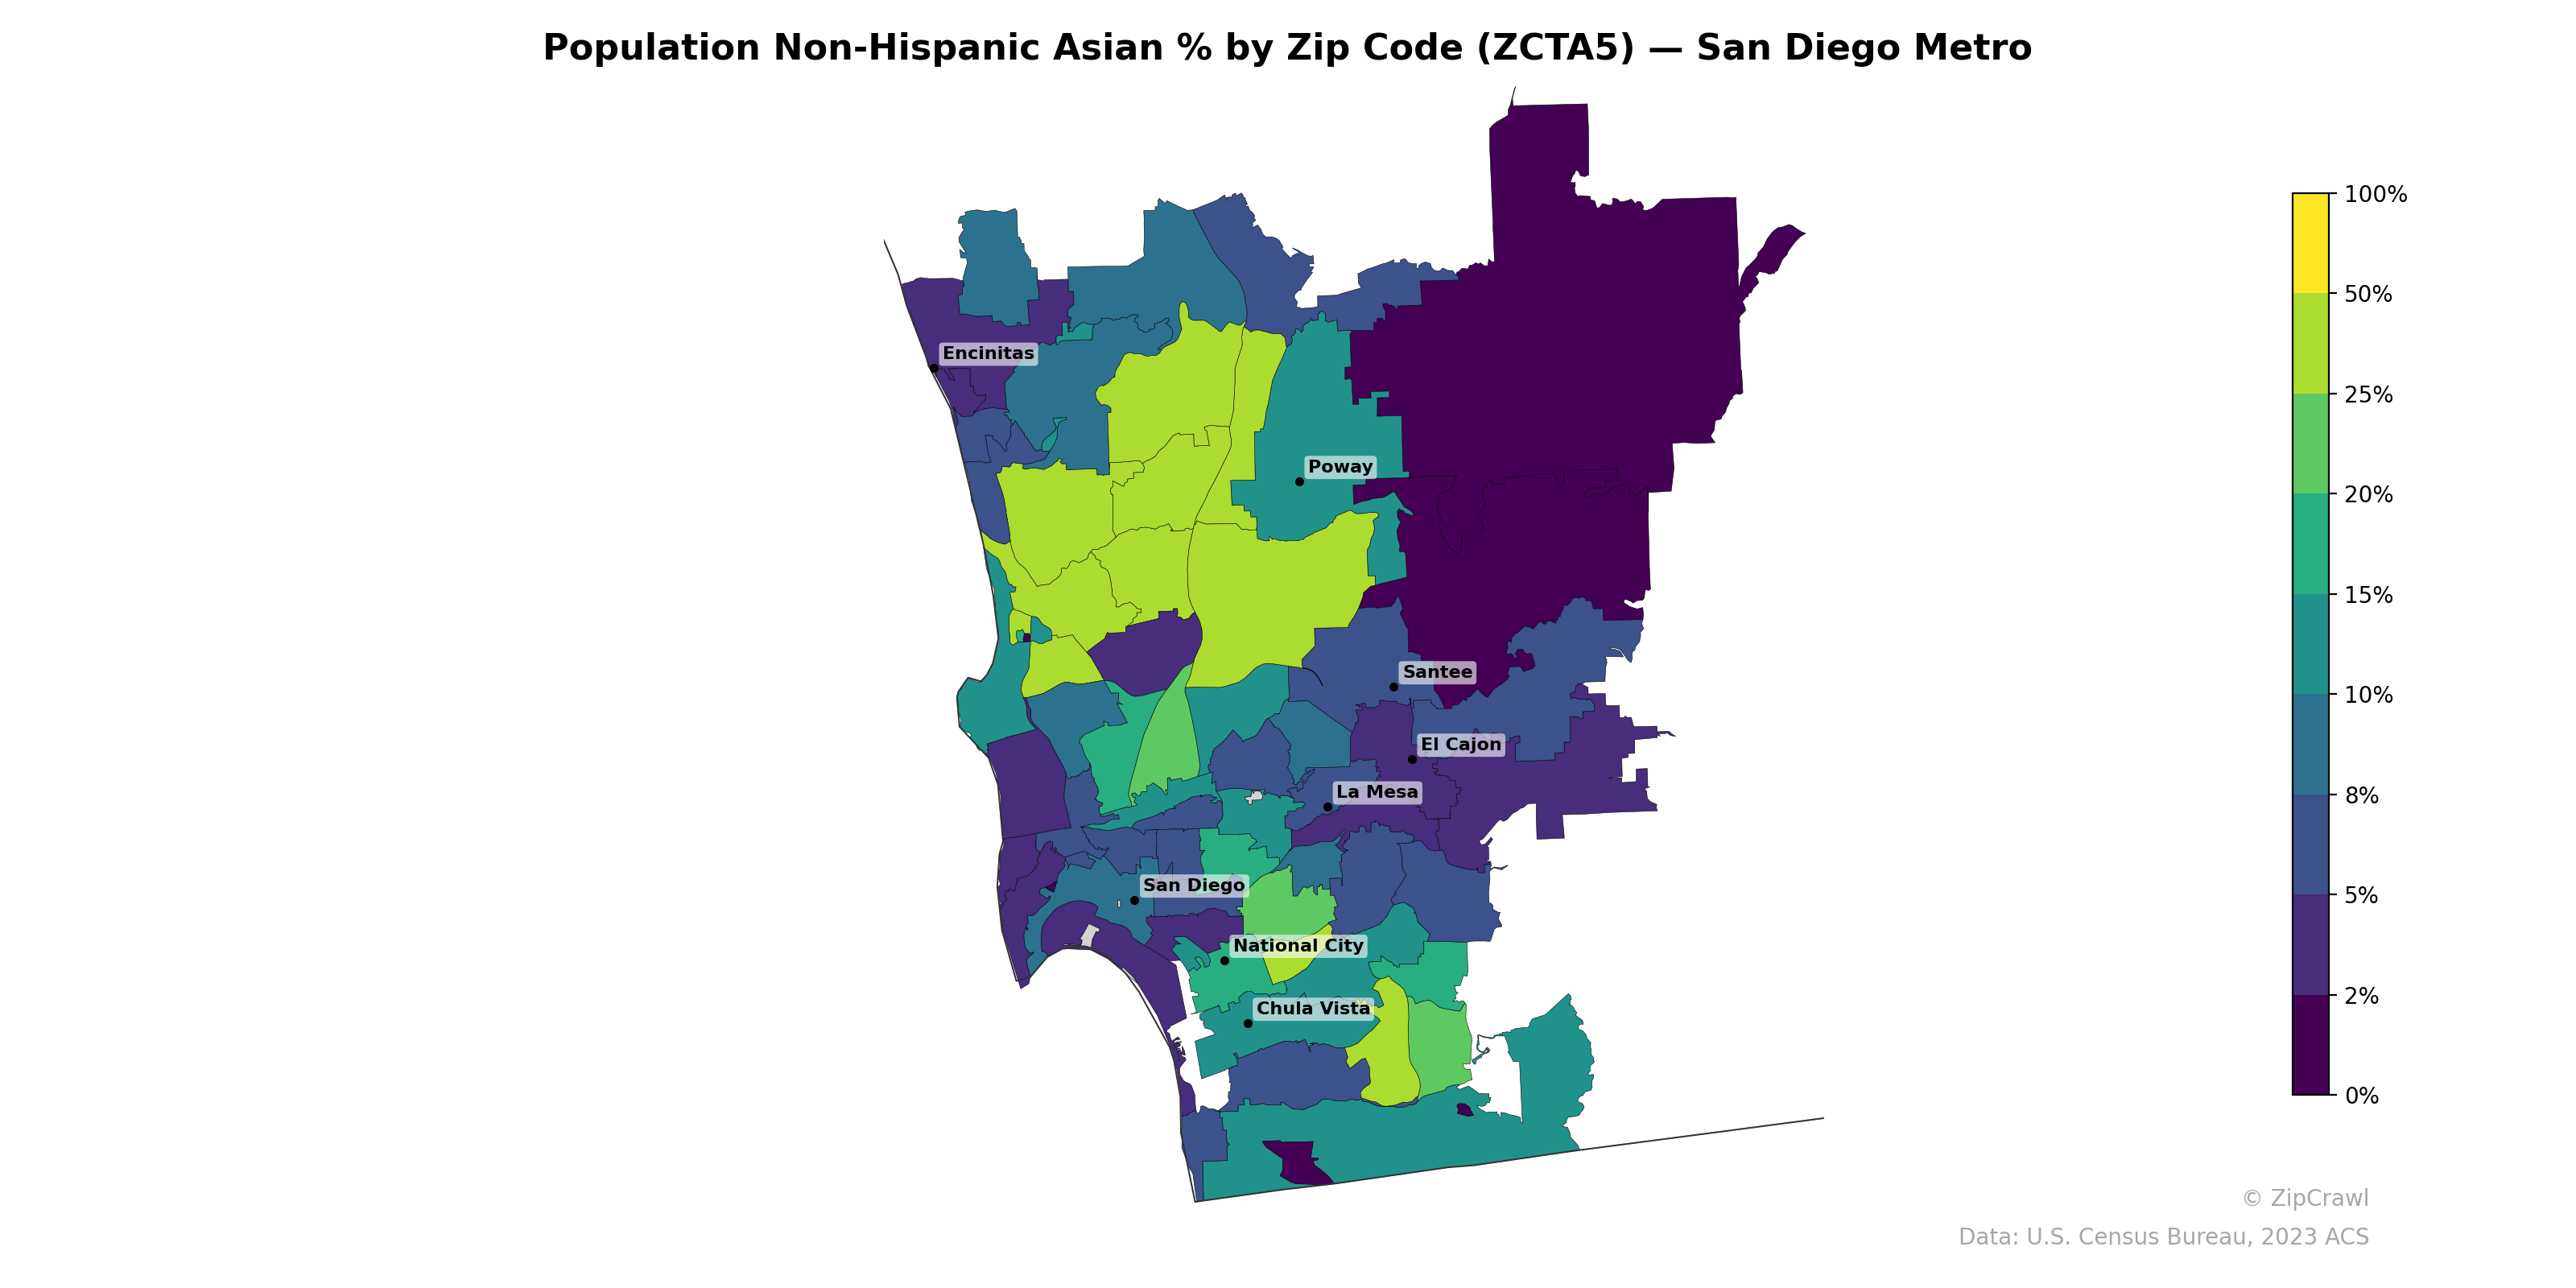
The highest concentrations of Non-Hispanic Asian residents, exceeding 25–50%, cluster in the inland zip codes stretching from the Mira Mesa and Rancho Peñasquitos corridor through Carmel Valley and into the Scripps Ranch area, forming a distinct band across north-central San Diego. In contrast, the large eastern zip codes beyond Santee and the southernmost areas near the U.S.-Mexico border register among the lowest percentages, generally below 5%. Coastal communities from Encinitas south through La Jolla and central San Diego neighborhoods display moderate representation in the 10–20% range, while National City stands out in the south with a notably higher Asian population share relative to its immediate surroundings.
Data: U.S. Census Bureau, 2023 ACS
Explore
- Housing Owner-Occupied Median Value ($), by Zip Code (ZCTA5) — Chicago Metro
- High School Graduate (% of Over 25) by Zip Code (ZCTA5) — Denver Metro
- Household Median Income by Zip Code (ZCTA5) — Denver Metro
- Population Non-Hispanic White % by Zip Code (ZCTA5) — Denver Metro
- Population Non-Hispanic American Indian % by Zip Code (ZCTA5) — Denver Metro
- Median Age by Zip Code (ZCTA5) — Denver Metro
- Population Non-Hispanic Black % by Zip Code (ZCTA5) — Denver Metro
- U.S. Citizens (% of Population Over 18) by Zip Code (ZCTA5) — Denver Metro
- % of Population on Food Stamps or SNAP (Last 12 Months), by Zip Code (ZCTA5) — San Diego Metro
- Population Hispanic % by Zip Code (ZCTA5) — Denver Metro
- Population Non-Hispanic American Indian % by County
- Married Couple (% of all Households) by Zip Code (ZCTA5) — Chicago Metro
- Housing Vacancy Rate by Zip Code (ZCTA5) — Chicago Metro
- Housing Owner-Occupied % of Units, by Zip Code (ZCTA5) — Chicago Metro
- Housing Median Monthly Rent ($), by Zip Code (ZCTA5) — Chicago Metro
- Bachelor's Degree or Higher (% of Over 25) by Zip Code (ZCTA5) — Chicago Metro
- % of Population on Food Stamps or SNAP (Last 12 Months), by Zip Code (ZCTA5) — New York Metro
- % of Households with Broadband Internet, by Zip Code (ZCTA5) — Chicago Metro
- % of Population without Health Insurance, by Zip Code (ZCTA5) — Chicago Metro
- Housing % of Units Built Since 2010, by Zip Code (ZCTA5) — Chicago Metro
- Household Average Size by Zip Code (ZCTA5) — Chicago Metro
- Housing Owner-Occupied Median Value ($), by Zip Code (ZCTA5) — Denver Metro
- % of Population without Health Insurance, by Zip Code (ZCTA5) — Denver Metro
- Housing % of Units Built Since 2010, by Zip Code (ZCTA5) — Denver Metro
- Bachelor's Degree or Higher (% of Over 25) by Zip Code (ZCTA5) — Denver Metro
- Household Average Size by Zip Code (ZCTA5) — Denver Metro
- Bachelor's Degree or Higher (% of Over 25) by Zip Code (ZCTA5) — Orlando Metro
- % of Households with Broadband Internet, by Zip Code (ZCTA5) — Denver Metro
- Housing Owner-Occupied % of Units, by Zip Code (ZCTA5) — Denver Metro
- Housing Median Monthly Rent ($), by Zip Code (ZCTA5) — Denver Metro
- Population Non-Hispanic Asian % by Zip Code (ZCTA5) — San Antonio Metro
- Population Non-Hispanic Asian % by Zip Code (ZCTA5) — Detroit Metro
- Population Non-Hispanic Asian % by Zip Code (ZCTA5) — Chicago Metro
- Population Non-Hispanic Asian % by Zip Code (ZCTA5) — Denver Metro
- Population Non-Hispanic Asian % by Zip Code (ZCTA5) — Dallas Metro
- Population Non-Hispanic Asian % by Zip Code (ZCTA5) — Miami Metro
- Population Non-Hispanic Asian % by Zip Code (ZCTA5) — Boston Metro
- Population Non-Hispanic Asian % by Zip Code (ZCTA5) — Seattle Metro
- Population Non-Hispanic Asian % by Zip Code (ZCTA5) — Houston Metro
- Population Non-Hispanic Asian % by Zip Code (ZCTA5) — Tampa Metro