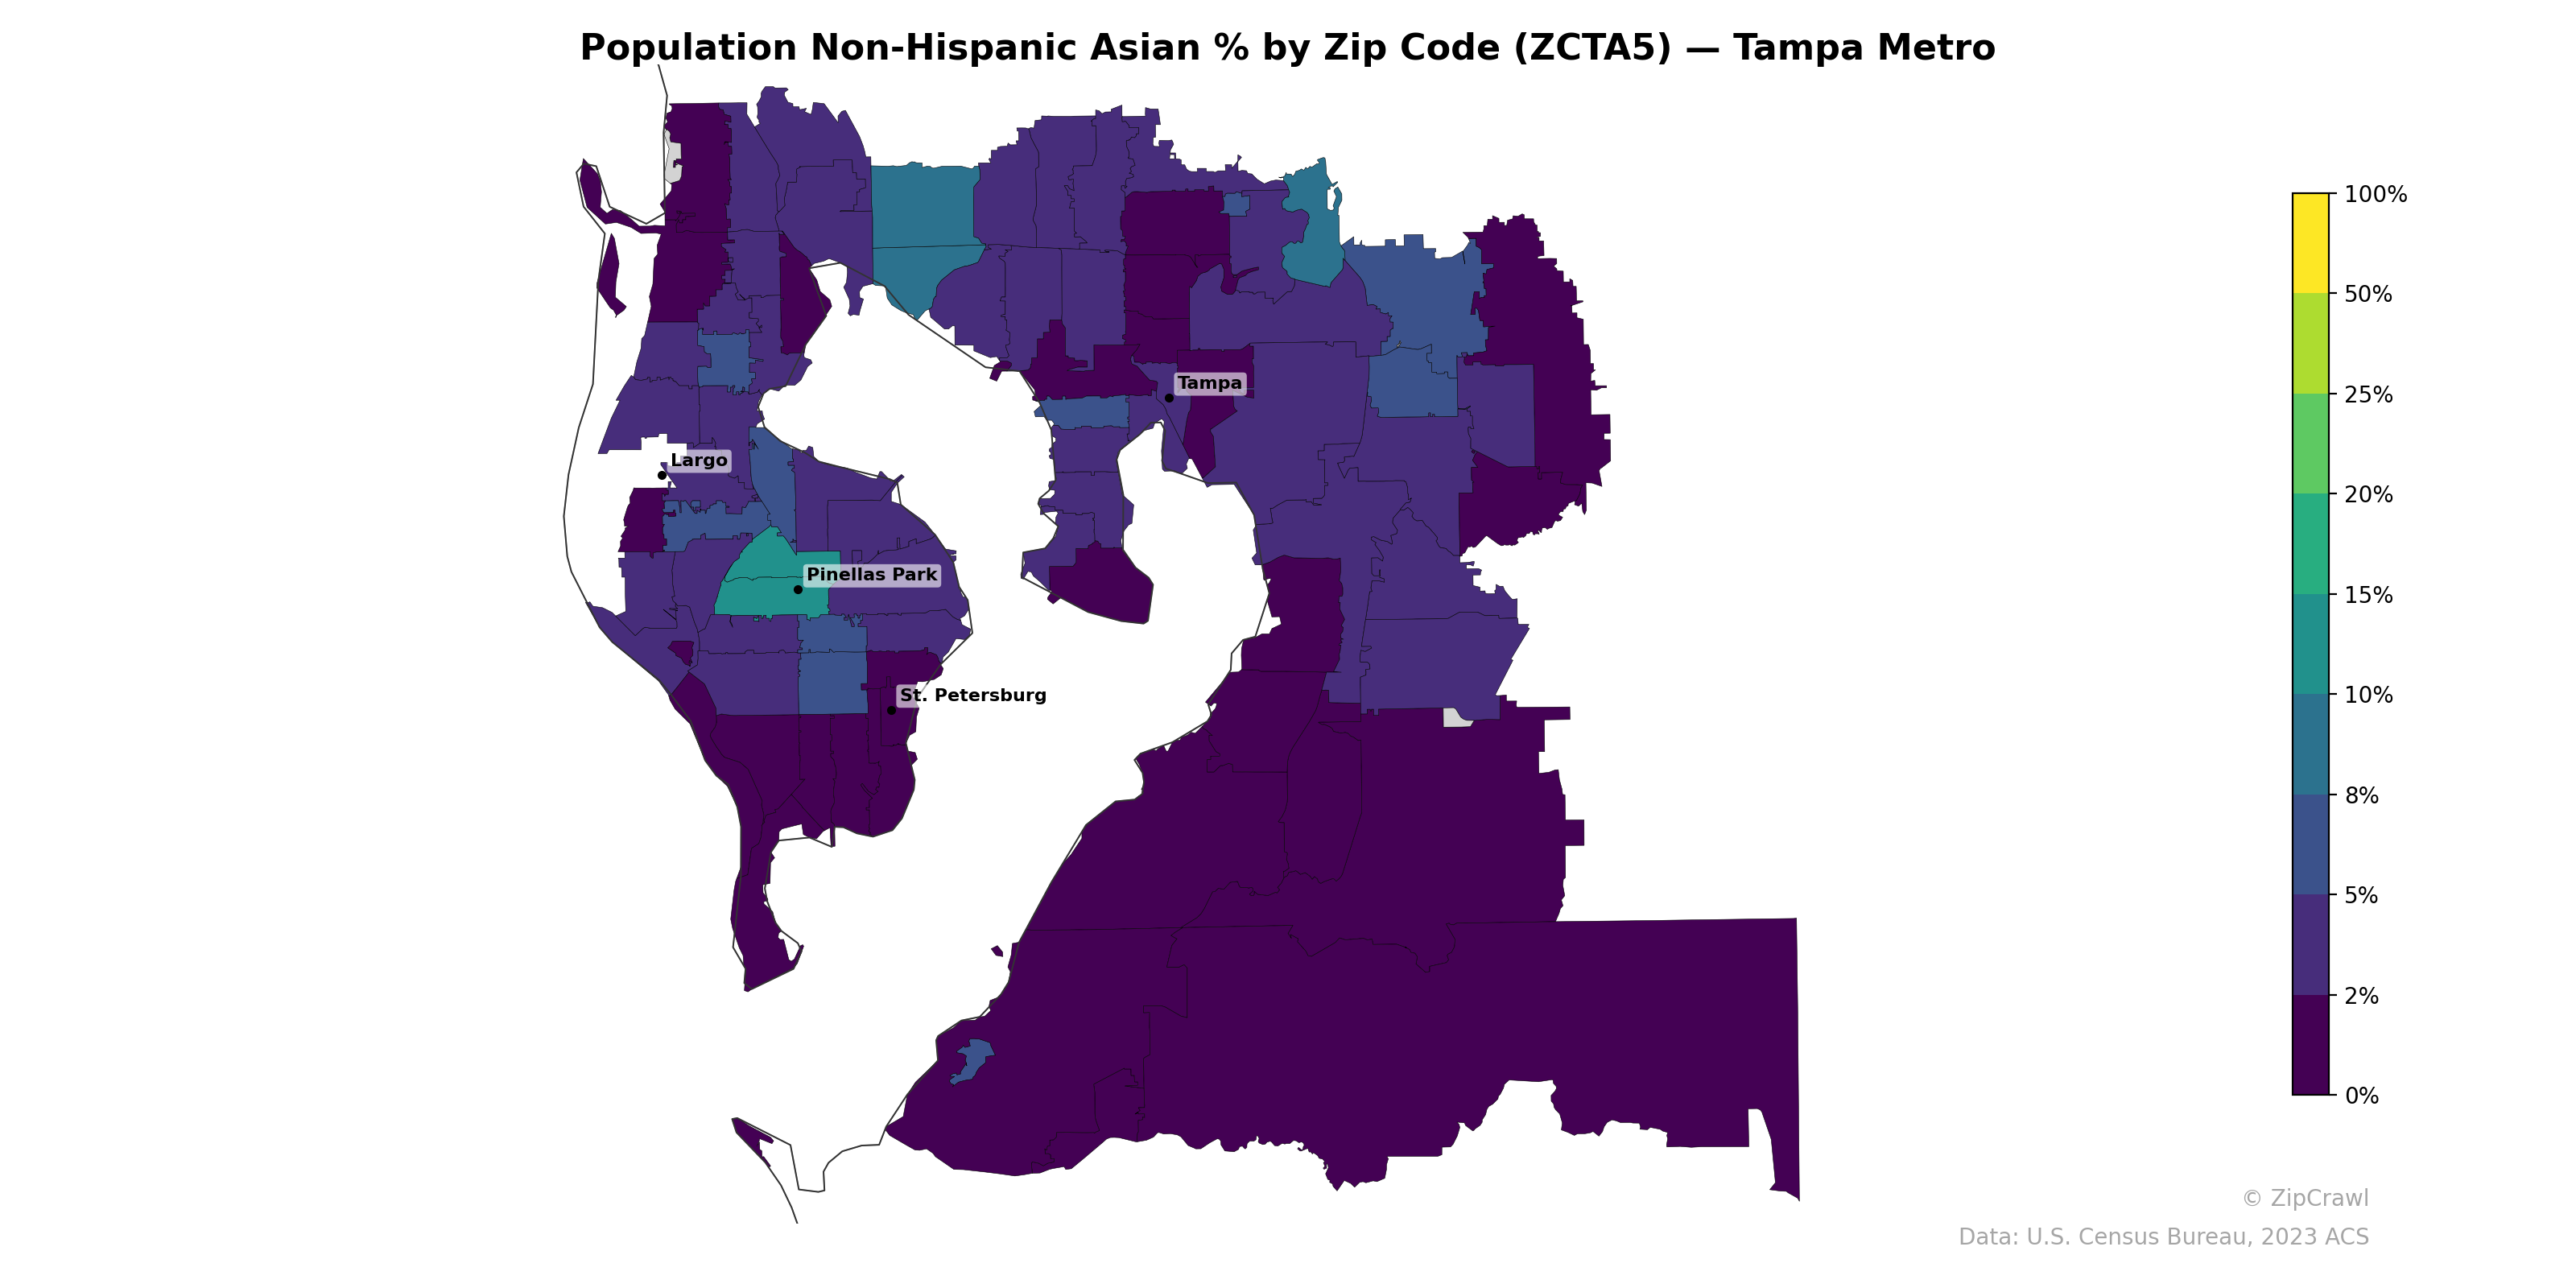
NOTE: Gray indicates insufficient data or a suppressed estimate.
The highest concentrations of Non-Hispanic Asian residents in the Tampa metro cluster in the northern suburbs, particularly in zip codes north of Tampa proper and in the Pinellas Park area, where percentages appear to reach the 10–20% range based on the teal shading. Most of the southern portions of both Hillsborough and Pinellas counties, along with St. Petersburg and Largo, register below 5%, creating a distinct north-south gradient across the metro. The far eastern and southeastern zip codes of Hillsborough County show uniformly low Asian population shares, generally at or below 2%, reflecting the more rural character of those areas.
Data: U.S. Census Bureau, 2023 ACS
Explore
- % of Population without Health Insurance, by Zip Code (ZCTA5) — Chicago Metro
- Population Non-Hispanic Black % by Zip Code (ZCTA5) — San Diego Metro
- U.S. Citizens (% of Population Over 18) by Zip Code (ZCTA5) — San Diego Metro
- Population Hispanic % by Zip Code (ZCTA5) — San Diego Metro
- High School Graduate (% of Over 25) by Zip Code (ZCTA5) — San Diego Metro
- Population Non-Hispanic White % by Zip Code (ZCTA5) — San Diego Metro
- Median Age by Zip Code (ZCTA5) — San Diego Metro
- Household Median Income by Zip Code (ZCTA5) — San Diego Metro
- Population Non-Hispanic American Indian % by Zip Code (ZCTA5) — San Diego Metro
- % of Population on Food Stamps or SNAP (Last 12 Months), by Zip Code (ZCTA5) — Tampa Metro
- Population Non-Hispanic American Indian % by County
- Married Couple (% of all Households) by Zip Code (ZCTA5) — Chicago Metro
- Housing Vacancy Rate by Zip Code (ZCTA5) — Chicago Metro
- Housing Owner-Occupied % of Units, by Zip Code (ZCTA5) — Chicago Metro
- Housing Median Monthly Rent ($), by Zip Code (ZCTA5) — Chicago Metro
- % of Population on Food Stamps or SNAP (Last 12 Months), by County
- Bachelor's Degree or Higher (% of Over 25) by Zip Code (ZCTA5) — Chicago Metro
- % of Households with Broadband Internet, by Zip Code (ZCTA5) — Chicago Metro
- Housing % of Units Built Since 2010, by Zip Code (ZCTA5) — Chicago Metro
- Housing Owner-Occupied Median Value ($), by Zip Code (ZCTA5) — Chicago Metro
- Household Average Size by Zip Code (ZCTA5) — Chicago Metro
- % of Population without Health Insurance, by Zip Code (ZCTA5) — Denver Metro
- Bachelor's Degree or Higher (% of Over 25) by Zip Code (ZCTA5) — Denver Metro
- Housing Owner-Occupied % of Units, by Zip Code (ZCTA5) — Denver Metro
- Population Hispanic % by Zip Code (ZCTA5) — Denver Metro
- Population Non-Hispanic White % by Zip Code (ZCTA5) — Denver Metro
- Population Non-Hispanic Black % by Zip Code (ZCTA5) — Denver Metro
- High School Graduate (% of Over 25) by Zip Code (ZCTA5) — Denver Metro
- % of Households with Broadband Internet, by Zip Code (ZCTA5) — Denver Metro
- Household Median Income by Zip Code (ZCTA5) — Denver Metro
- Population Non-Hispanic Asian % by Zip Code (ZCTA5) — Boston Metro
- Population Non-Hispanic Asian % by Zip Code (ZCTA5) — Miami Metro
- Population Non-Hispanic Asian % by Zip Code (ZCTA5) — Houston Metro
- Population Non-Hispanic Asian % by Zip Code (ZCTA5) — Austin Metro
- Population Non-Hispanic Asian % by Zip Code (ZCTA5) — Detroit Metro
- Population Non-Hispanic Asian % by Zip Code (ZCTA5) — Chicago Metro
- Population Non-Hispanic Asian % by Zip Code (ZCTA5) — Phoenix Metro
- Population Non-Hispanic Asian % by Zip Code (ZCTA5) — Atlanta Metro
- Population Non-Hispanic Asian % by Zip Code (ZCTA5) — Dallas Metro
- Population Non-Hispanic Asian % by Zip Code (ZCTA5) — Denver Metro