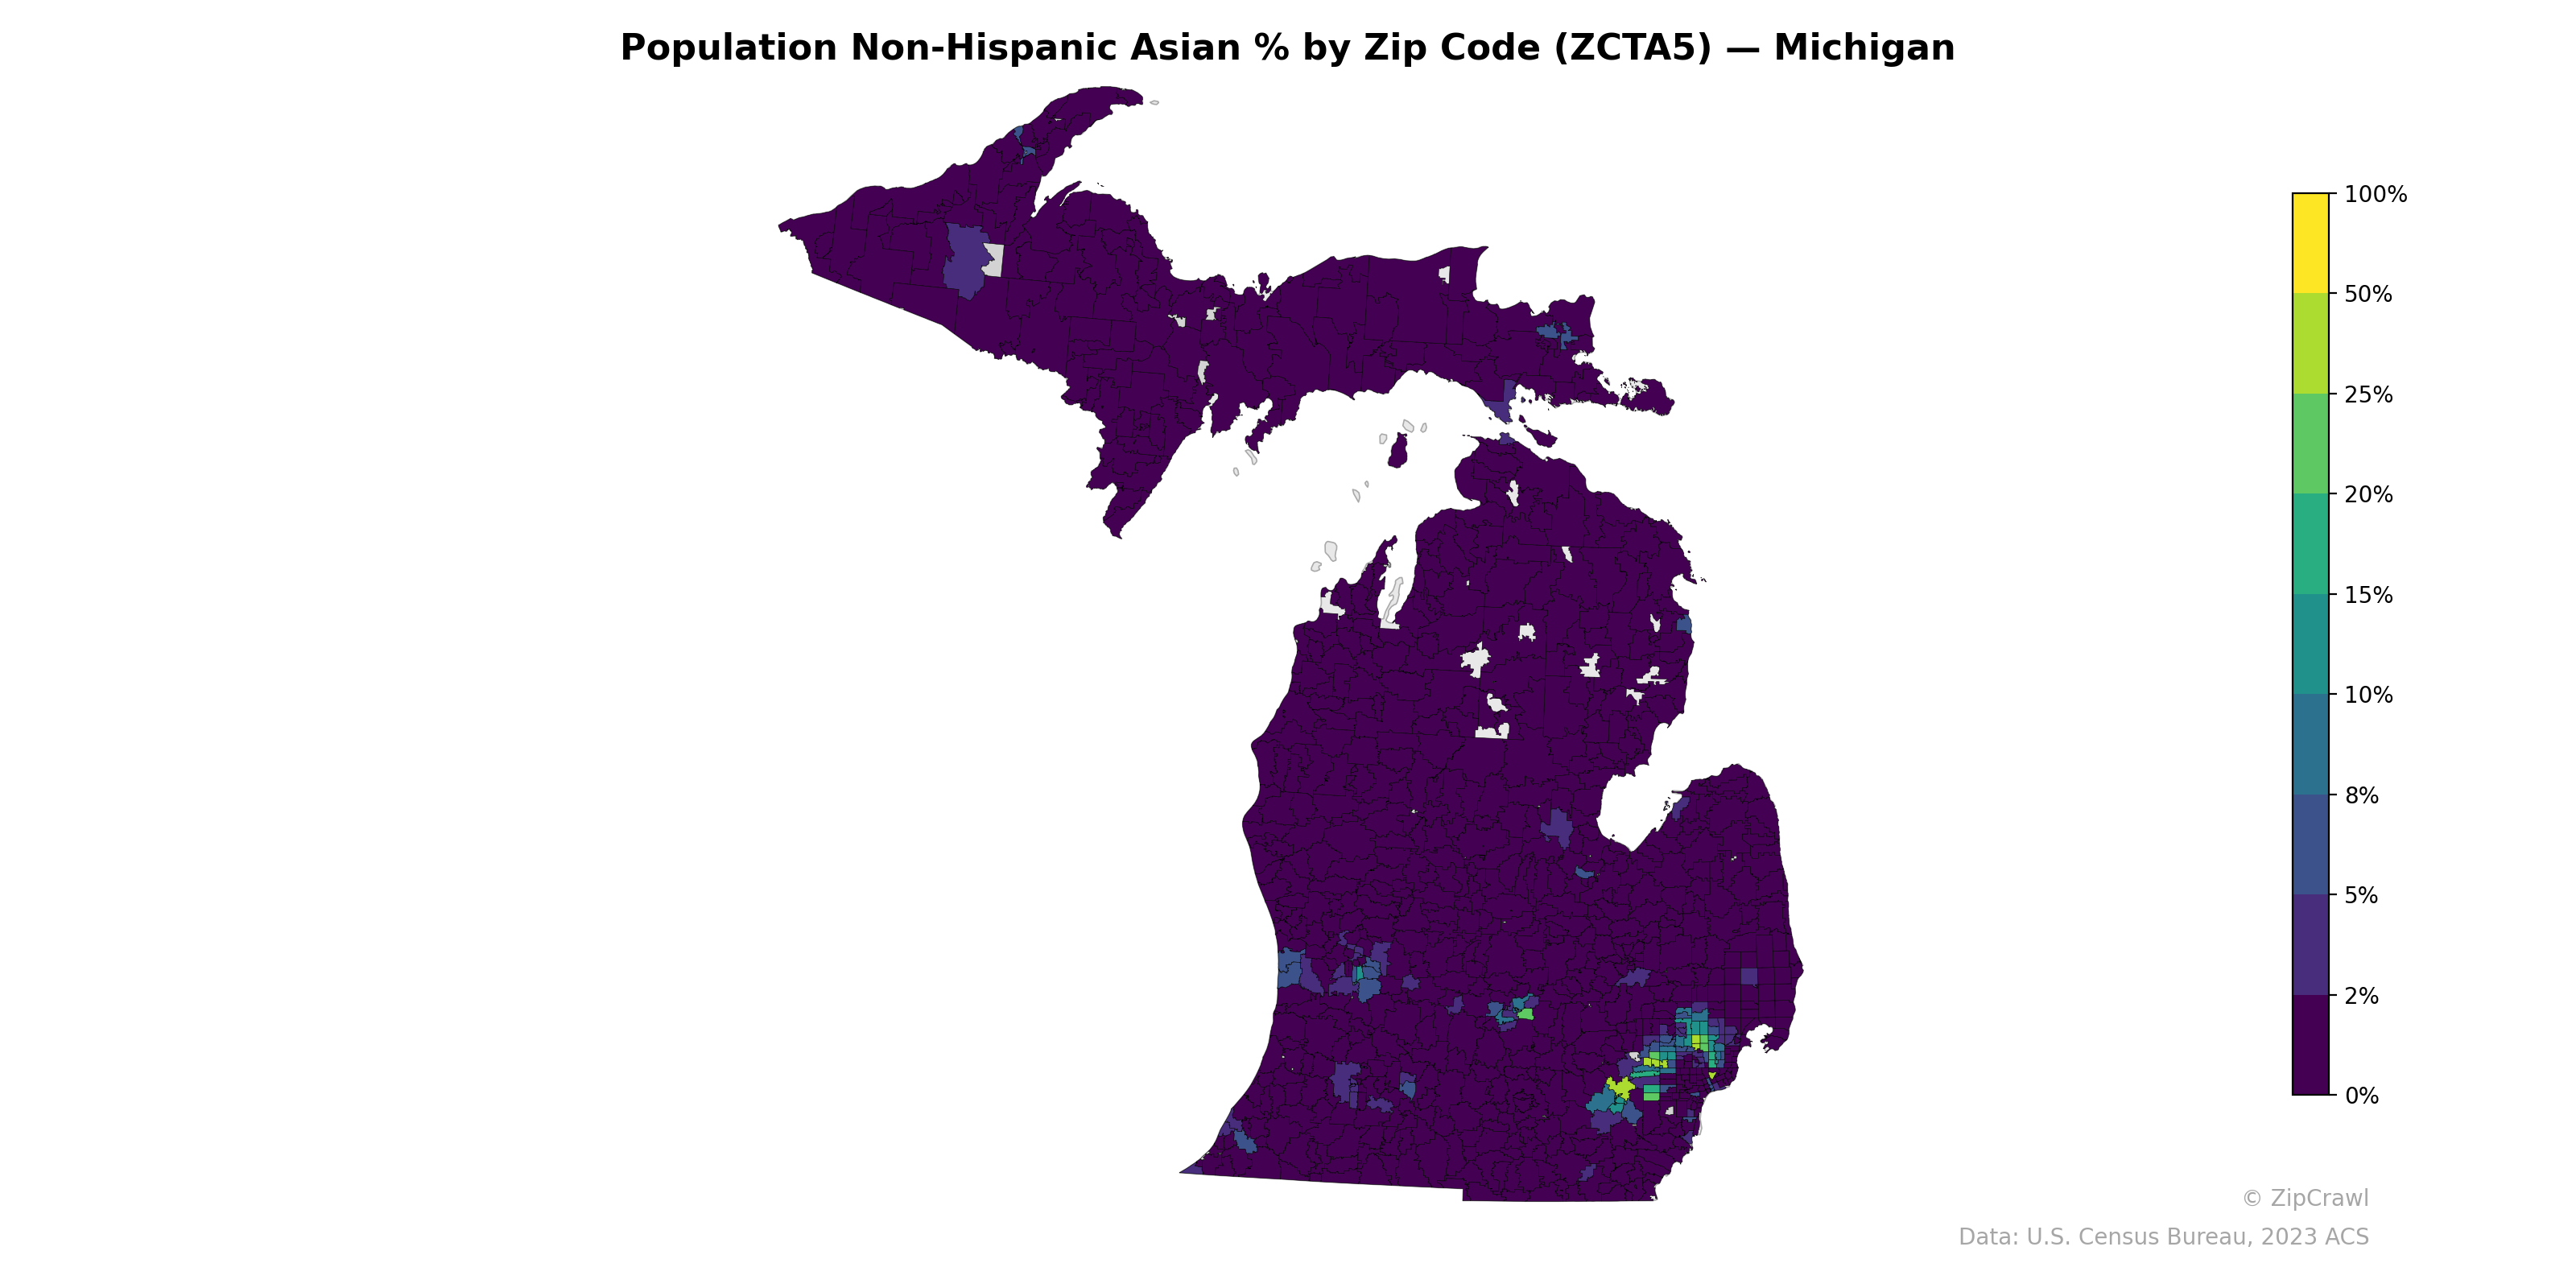
NOTE: Gray indicates insufficient data or a suppressed estimate.
The highest concentrations of Non-Hispanic Asian residents in Michigan cluster prominently in the southeastern metro Detroit area, particularly in zip codes around Troy, Novi, and Canton, where percentages reach 25–50% or higher, reflecting established South Asian and East Asian communities. A secondary but much smaller concentration appears in the Upper Peninsula near Marquette, likely associated with Northern Michigan University. The vast majority of the state, especially rural areas across both peninsulas, registers near 0–2%, creating a stark urban-rural divide in Asian population distribution.
Data: U.S. Census Bureau, 2023 ACS
Explore
- Housing Median Monthly Rent ($), by Zip Code (ZCTA5) — New York Metro
- High School Graduate (% of Over 25) by Zip Code (ZCTA5) — New Jersey
- % of Population on Food Stamps or SNAP (Last 12 Months), by Zip Code (ZCTA5) — Michigan
- Population Non-Hispanic American Indian % by Zip Code (ZCTA5) — New Jersey
- U.S. Citizens (% of Population Over 18) by Zip Code (ZCTA5) — New Jersey
- Household Median Income by Zip Code (ZCTA5) — New Jersey
- Population Non-Hispanic White % by Zip Code (ZCTA5) — New Jersey
- Population Non-Hispanic Black % by Zip Code (ZCTA5) — New Jersey
- Population Hispanic % by Zip Code (ZCTA5) — New Jersey
- Median Age by Zip Code (ZCTA5) — New Jersey
- Population Non-Hispanic American Indian % by Zip Code (ZCTA5) — New Mexico
- Population Non-Hispanic White % by County
- % of Population without Health Insurance, by Zip Code (ZCTA5) — New York Metro
- % of Population on Food Stamps or SNAP (Last 12 Months), by Zip Code (ZCTA5) — New York Metro
- Housing Vacancy Rate by Zip Code (ZCTA5) — New York Metro
- Household Average Size by Zip Code (ZCTA5) — New York Metro
- Housing Owner-Occupied Median Value ($), by Zip Code (ZCTA5) — New York Metro
- % of Households with Broadband Internet, by Zip Code (ZCTA5) — New York Metro
- Housing % of Units Built Since 2010, by Zip Code (ZCTA5) — New York Metro
- Married Couple (% of all Households) by Zip Code (ZCTA5) — New York Metro
- Married Couple (% of all Households) by Zip Code (ZCTA5) — North Carolina
- Housing % of Units Built Since 2010, by Zip Code (ZCTA5) — North Carolina
- Housing Vacancy Rate by Zip Code (ZCTA5) — North Carolina
- % of Households with Broadband Internet, by Zip Code (ZCTA5) — North Carolina
- Bachelor's Degree or Higher (% of Over 25) by Zip Code (ZCTA5) — North Carolina
- % of Population without Health Insurance, by Zip Code (ZCTA5) — North Carolina
- Housing Owner-Occupied Median Value ($), by Zip Code (ZCTA5) — North Carolina
- Housing Median Monthly Rent ($), by Zip Code (ZCTA5) — North Carolina
- Household Average Size by Zip Code (ZCTA5) — North Carolina
- Population Non-Hispanic American Indian % by Zip Code (ZCTA5) — North Carolina
- Population Non-Hispanic Asian % by Zip Code (ZCTA5) — Maine
- Population Non-Hispanic Asian % by Zip Code (ZCTA5) — Missouri
- Population Non-Hispanic Asian % by Zip Code (ZCTA5) — Iowa
- Population Non-Hispanic Asian % by Zip Code (ZCTA5) — Ohio
- Population Non-Hispanic Asian % by Zip Code (ZCTA5) — Utah
- Population Non-Hispanic Asian % by Zip Code (ZCTA5) — Minnesota
- Population Non-Hispanic Asian % by Zip Code (ZCTA5) — Mississippi
- Population Non-Hispanic Asian % by Zip Code (ZCTA5) — Montana
- Population Non-Hispanic Asian % by Zip Code (ZCTA5) — Texas
- Population Non-Hispanic Asian % by Zip Code (ZCTA5) — Oregon