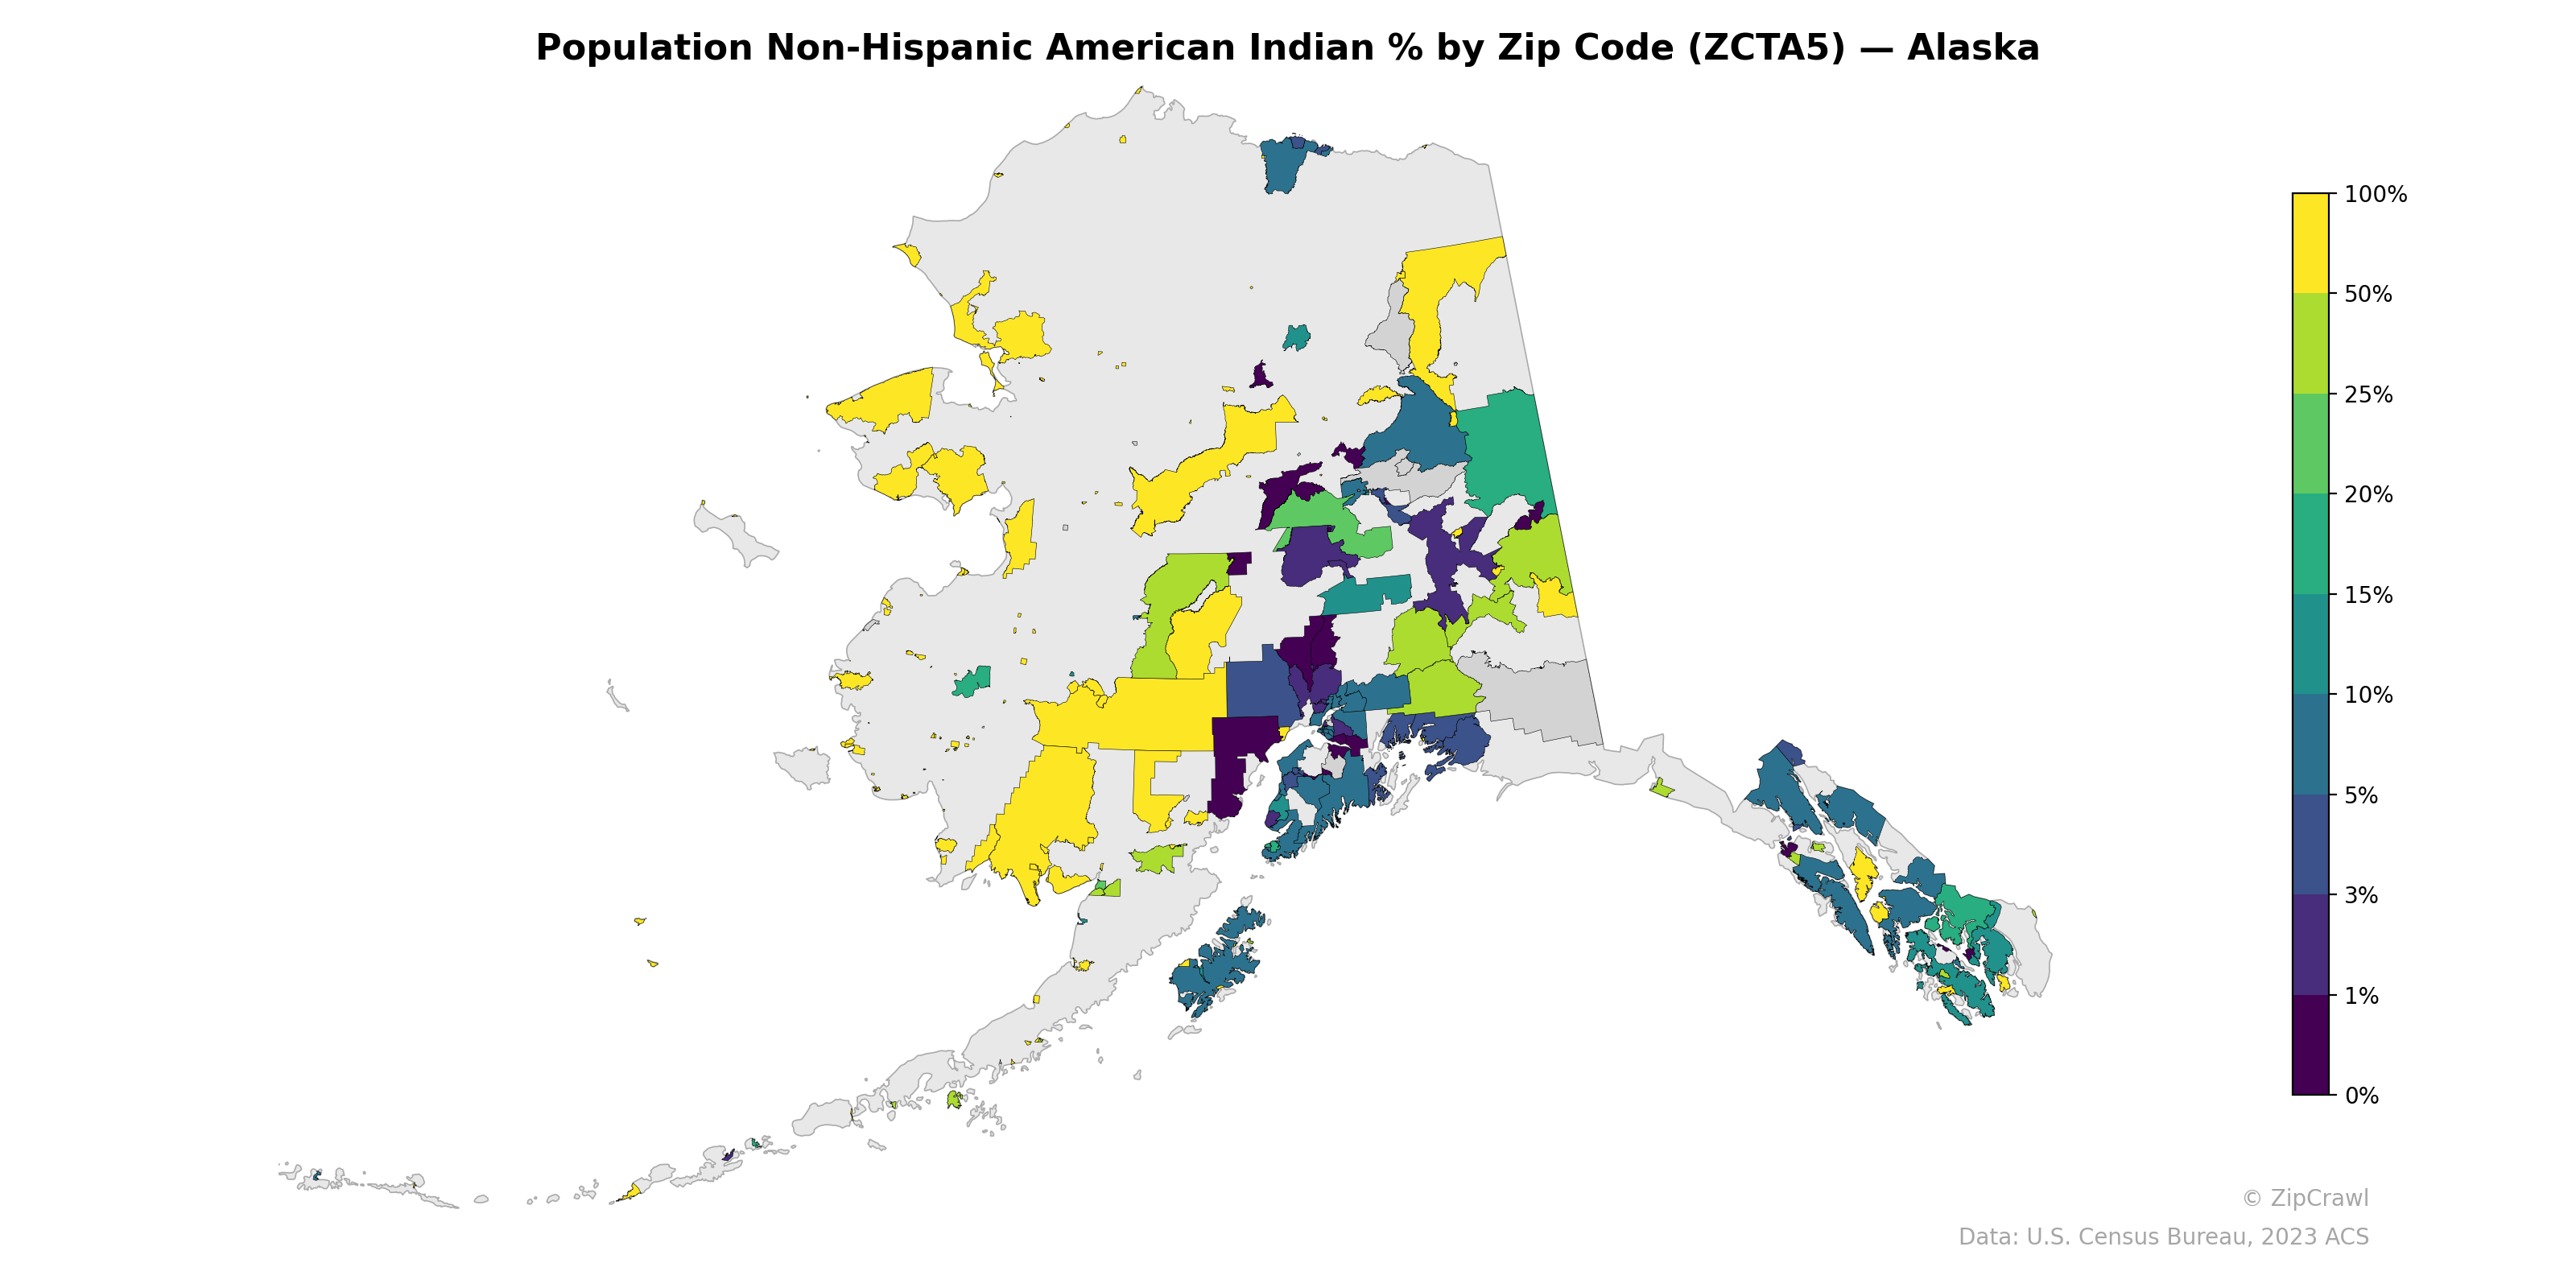
NOTE: Gray indicates insufficient data or a suppressed estimate.
Western and northern Alaska zip codes consistently display the highest concentrations of Non-Hispanic American Indian population, frequently exceeding 50% and approaching 100% in many rural areas along the western coast and interior villages. The south-central region around Anchorage and the Matanuska-Susitna Valley stands in sharp contrast, with zip codes predominantly falling below 5%, reflecting the state's most urbanized and demographically diverse corridor. Southeast Alaska's panhandle exhibits moderate percentages generally in the 5–15% range, with occasional higher-percentage pockets likely corresponding to smaller communities with significant Tlingit and Haida populations.
Data: U.S. Census Bureau, 2023 ACS
Explore
- Married Couple (% of all Households) by Zip Code (ZCTA5) — New York
- Housing % of Units Built Since 2010, by Zip Code (ZCTA5) — Alaska
- Housing Owner-Occupied Median Value ($), by Zip Code (ZCTA5) — Alaska
- % of Population without Health Insurance, by Zip Code (ZCTA5) — Alaska
- High School Graduate (% of Over 25) by Zip Code (ZCTA5) — Alaska
- Household Average Size by Zip Code (ZCTA5) — Alaska
- Housing Median Monthly Rent ($), by Zip Code (ZCTA5) — Alaska
- Housing Owner-Occupied % of Units, by Zip Code (ZCTA5) — Alaska
- Bachelor's Degree or Higher (% of Over 25) by Zip Code (ZCTA5) — Alaska
- % of Households with Broadband Internet, by Zip Code (ZCTA5) — Alaska
- Household Average Size by County
- Population Non-Hispanic Asian % by Zip Code (ZCTA5) — Illinois
- Household Average Size by Zip Code (ZCTA5) — New York
- Population Non-Hispanic Asian % by Zip Code (ZCTA5) — Missouri
- Housing Owner-Occupied Median Value ($), by Zip Code (ZCTA5) — New York
- % of Population without Health Insurance, by Zip Code (ZCTA5) — New York
- Housing Median Monthly Rent ($), by Zip Code (ZCTA5) — New York
- Housing Vacancy Rate by Zip Code (ZCTA5) — New York
- Bachelor's Degree or Higher (% of Over 25) by Zip Code (ZCTA5) — New York
- % of Households with Broadband Internet, by Zip Code (ZCTA5) — New York
- Housing % of Units Built Since 2010, by Zip Code (ZCTA5) — New York
- Housing Owner-Occupied % of Units, by Zip Code (ZCTA5) — New York
- High School Graduate (% of Over 25) by Zip Code (ZCTA5) — Rhode Island
- Population Non-Hispanic Black % by Zip Code (ZCTA5) — North Dakota
- Housing Vacancy Rate by Zip Code (ZCTA5) — Rhode Island
- Bachelor's Degree or Higher (% of Over 25) by Zip Code (ZCTA5) — Rhode Island
- Household Average Size by Zip Code (ZCTA5) — Rhode Island
- Population Hispanic % by Zip Code (ZCTA5) — Oregon
- Housing Vacancy Rate by Zip Code (ZCTA5) — Alaska
- Married Couple (% of all Households) by Zip Code (ZCTA5) — Rhode Island
- Population Non-Hispanic American Indian % by Zip Code (ZCTA5) — Nebraska
- Population Non-Hispanic American Indian % by Zip Code (ZCTA5) — Indiana
- Population Non-Hispanic American Indian % by Zip Code (ZCTA5) — Alabama
- Population Non-Hispanic American Indian % by Zip Code (ZCTA5) — Iowa
- Population Non-Hispanic American Indian % by Zip Code (ZCTA5) — Utah
- Population Non-Hispanic American Indian % by Zip Code (ZCTA5) — Idaho
- Population Non-Hispanic American Indian % by Zip Code (ZCTA5) — Ohio
- Population Non-Hispanic American Indian % by Zip Code (ZCTA5) — Nevada
- Population Non-Hispanic American Indian % by Zip Code (ZCTA5) — Texas
- Population Non-Hispanic American Indian % by Zip Code (ZCTA5) — Oregon