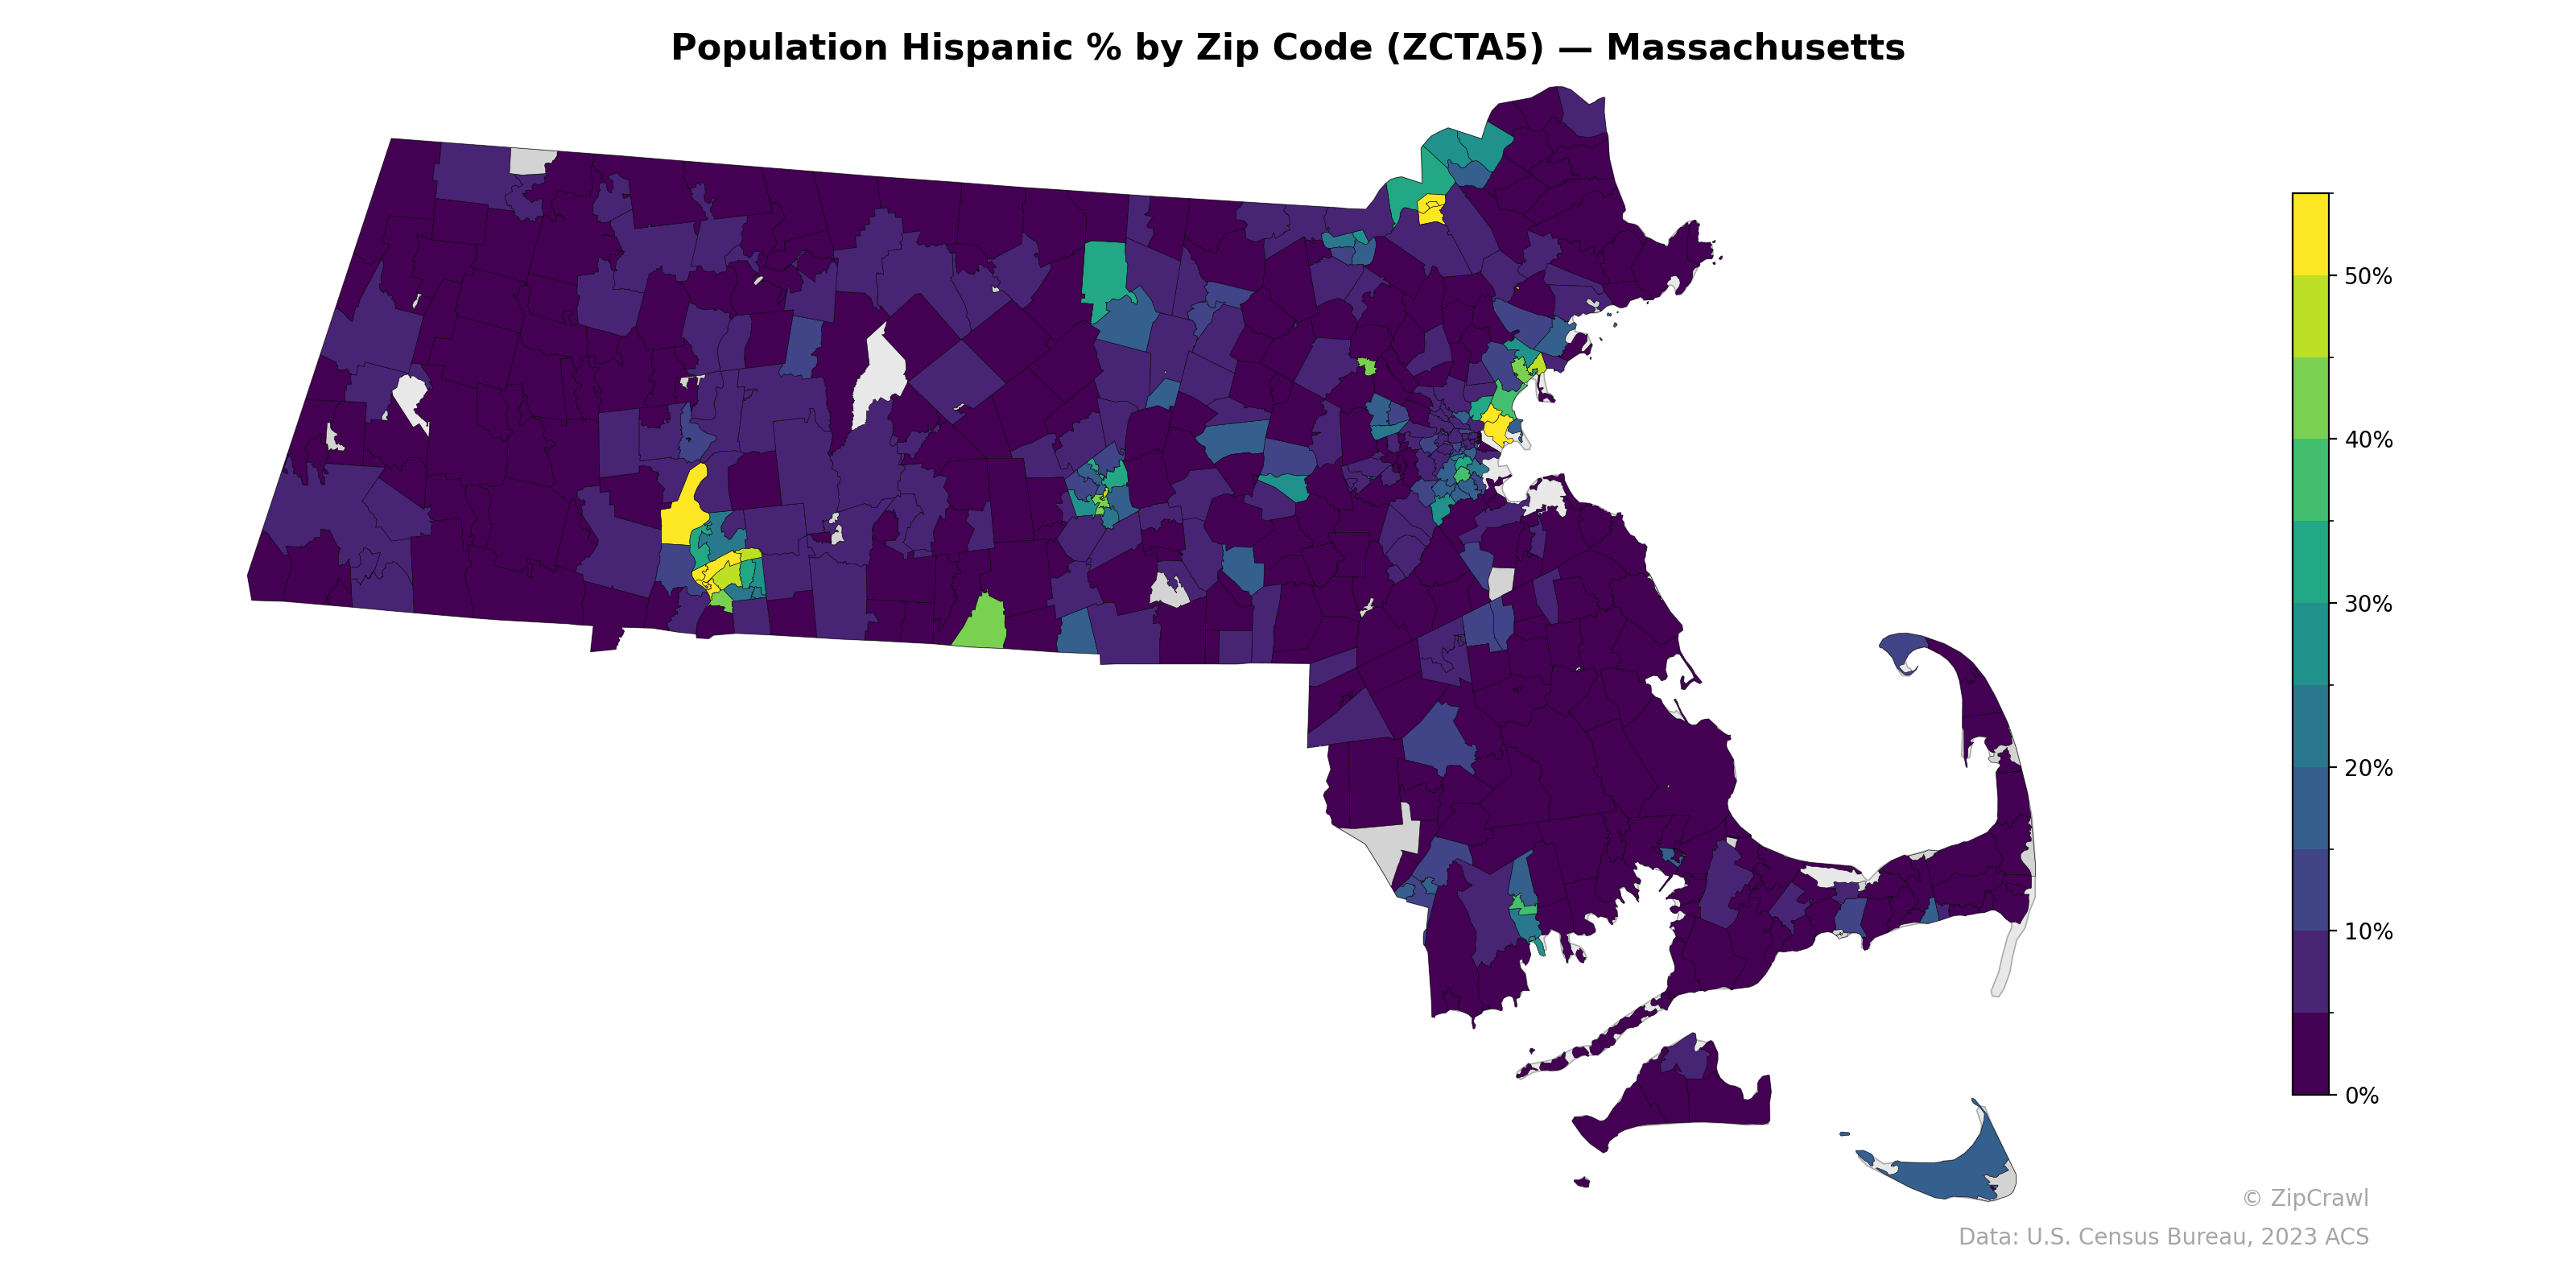
NOTE: Gray indicates insufficient data or a suppressed estimate.
Hispanic population concentrations in Massachusetts are most pronounced in the Gateway Cities corridor, with zip codes in Springfield, Holyoke, Lawrence, and Lynn reaching above 50%, appearing as bright yellow and green clusters in the western interior and northeastern portions of the state. The greater Boston metro area displays moderate Hispanic percentages in select urban zip codes, particularly in Chelsea and East Boston, while surrounding suburban communities remain predominantly in the low single digits. Cape Cod, the Islands, and much of the rural western hill towns register among the lowest Hispanic population shares statewide, creating a stark urban-rural divide in the distribution pattern.
Data: U.S. Census Bureau, 2023 ACS
Explore
- % of Population without Health Insurance, by Zip Code (ZCTA5) — Los Angeles Metro
- Population Non-Hispanic White % by Zip Code (ZCTA5) — Massachusetts
- Population Non-Hispanic Asian % by Zip Code (ZCTA5) — Tennessee
- Population Non-Hispanic Black % by Zip Code (ZCTA5) — Massachusetts
- U.S. Citizens (% of Population Over 18) by Zip Code (ZCTA5) — Massachusetts
- Household Median Income by Zip Code (ZCTA5) — Massachusetts
- Population Non-Hispanic American Indian % by Zip Code (ZCTA5) — Massachusetts
- % of Population on Food Stamps or SNAP (Last 12 Months), by Zip Code (ZCTA5) — Tennessee
- Median Age by Zip Code (ZCTA5) — Massachusetts
- High School Graduate (% of Over 25) by Zip Code (ZCTA5) — Massachusetts
- Housing Owner-Occupied Median Value ($), by Zip Code (ZCTA5) — Delaware
- Population Non-Hispanic Black % by County
- Married Couple (% of all Households) by Zip Code (ZCTA5) — Los Angeles Metro
- Housing Median Monthly Rent ($), by Zip Code (ZCTA5) — Los Angeles Metro
- Household Average Size by Zip Code (ZCTA5) — Los Angeles Metro
- % of Households with Broadband Internet, by Zip Code (ZCTA5) — Los Angeles Metro
- Housing Owner-Occupied % of Units, by Zip Code (ZCTA5) — Los Angeles Metro
- Population Non-Hispanic Black % by Zip Code (ZCTA5) — New York Metro
- Bachelor's Degree or Higher (% of Over 25) by Zip Code (ZCTA5) — Los Angeles Metro
- Housing % of Units Built Since 2010, by Zip Code (ZCTA5) — Los Angeles Metro
- Housing Owner-Occupied Median Value ($), by Zip Code (ZCTA5) — Los Angeles Metro
- Housing Vacancy Rate by Zip Code (ZCTA5) — Los Angeles Metro
- Housing Owner-Occupied Median Value ($), by Zip Code (ZCTA5) — Tennessee
- % of Population without Health Insurance, by Zip Code (ZCTA5) — Tennessee
- Housing Median Monthly Rent ($), by Zip Code (ZCTA5) — Tennessee
- Population Non-Hispanic Black % by Zip Code (ZCTA5) — Tennessee
- Bachelor's Degree or Higher (% of Over 25) by Zip Code (ZCTA5) — Tennessee
- % of Households with Broadband Internet, by Zip Code (ZCTA5) — Tennessee
- Housing Owner-Occupied % of Units, by Zip Code (ZCTA5) — Tennessee
- Population Non-Hispanic White % by Zip Code (ZCTA5) — Tennessee
- Population Hispanic % by Zip Code (ZCTA5) — Maine
- Population Hispanic % by Zip Code (ZCTA5) — Maryland
- Population Hispanic % by Zip Code (ZCTA5) — Utah
- Population Hispanic % by Zip Code (ZCTA5) — Iowa
- Population Hispanic % by Zip Code (ZCTA5) — Ohio
- Population Hispanic % by Zip Code (ZCTA5) — Montana
- Population Hispanic % by Zip Code (ZCTA5) — Texas
- Population Hispanic % by Zip Code (ZCTA5) — Idaho
- Population Hispanic % by Zip Code (ZCTA5) — Hawaii
- Population Hispanic % by Zip Code (ZCTA5) — Oregon