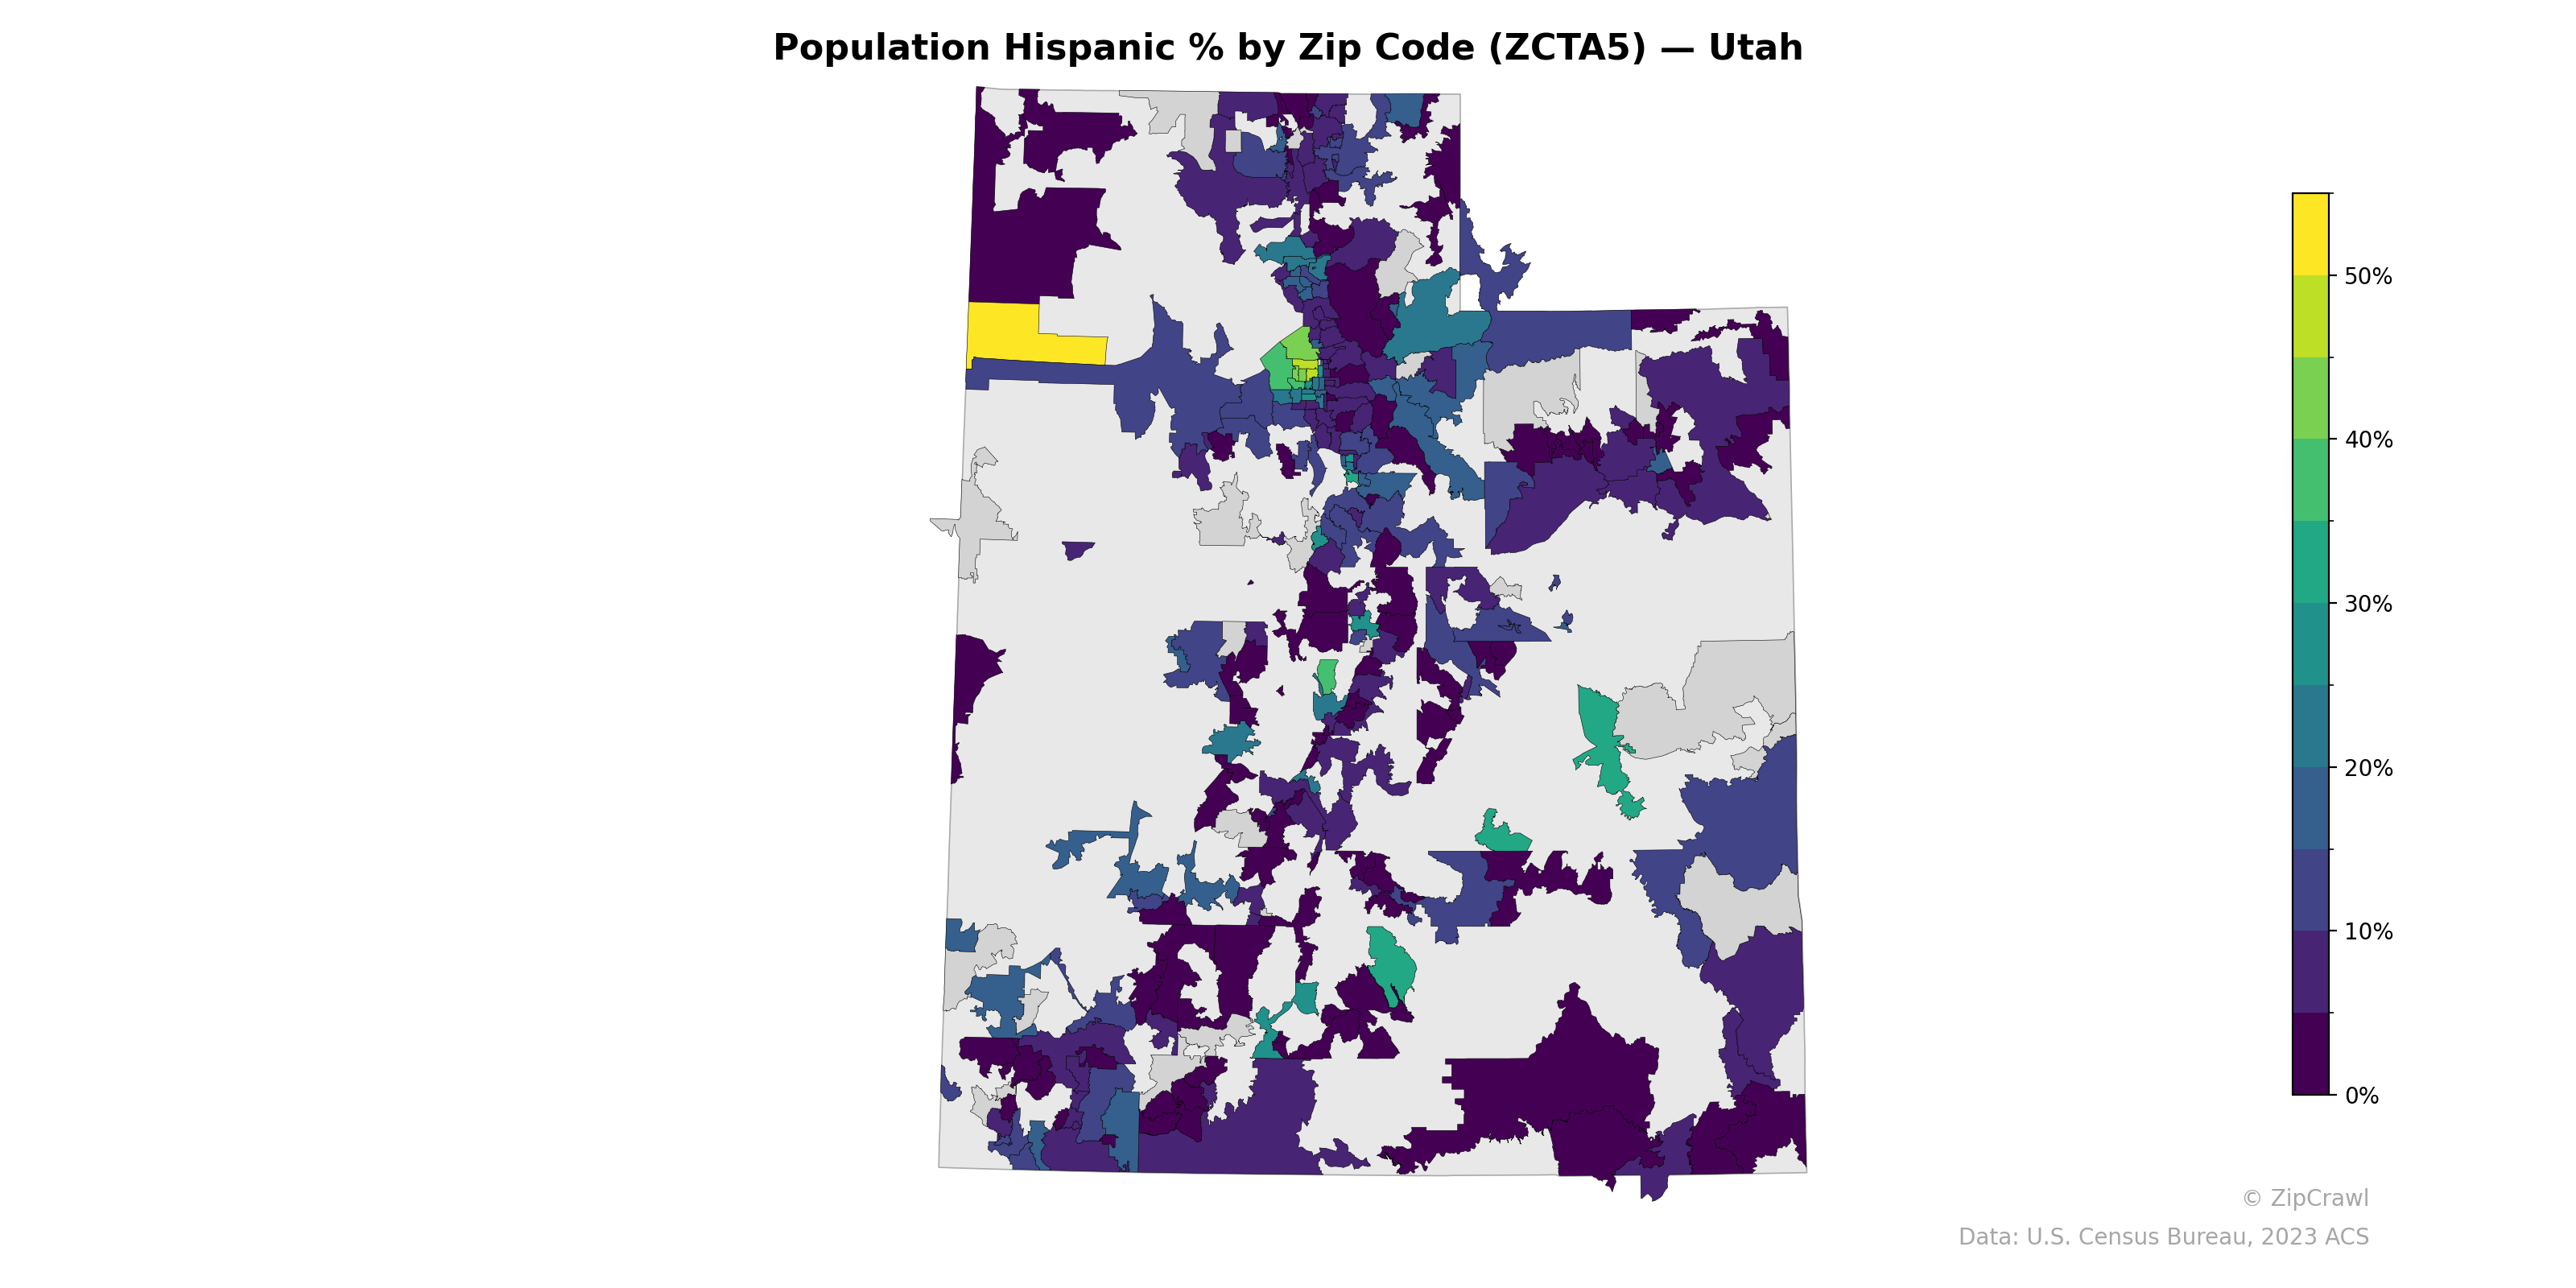
NOTE: Gray indicates insufficient data or a suppressed estimate.
The highest Hispanic population concentrations in Utah appear in the Salt Lake City metro area, particularly in zip codes west of downtown, where percentages reach 40–55%, along with a notable yellow-shaded cluster in the northwestern part of the state near the Wendover area. A secondary corridor of elevated Hispanic percentages (15–25%) extends southward along the Wasatch Front through Provo and into central Utah's rural communities. Eastern Utah and the state's more remote rural zip codes generally exhibit the lowest Hispanic population shares, typically below 5%, creating a stark contrast with the urbanized western corridor.
Data: U.S. Census Bureau, 2023 ACS
Explore
- % of Population on Food Stamps or SNAP (Last 12 Months), by Zip Code (ZCTA5) — California
- Population Non-Hispanic Black % by Zip Code (ZCTA5) — Utah
- Population Non-Hispanic Asian % by Zip Code (ZCTA5) — Connecticut
- % of Population on Food Stamps or SNAP (Last 12 Months), by Zip Code (ZCTA5) — Connecticut
- Population Non-Hispanic White % by Zip Code (ZCTA5) — Utah
- Married Couple (% of all Households) by Zip Code (ZCTA5) — Connecticut
- Housing Vacancy Rate by Zip Code (ZCTA5) — Connecticut
- Median Age by Zip Code (ZCTA5) — Utah
- Household Median Income by Zip Code (ZCTA5) — Utah
- U.S. Citizens (% of Population Over 18) by Zip Code (ZCTA5) — Utah
- Housing % of Units Built Since 2010, by County
- Housing Owner-Occupied Median Value ($), by County
- High School Graduate (% of Over 25) by Zip Code (ZCTA5) — Florida
- Married Couple (% of all Households) by Zip Code (ZCTA5) — California
- Population Non-Hispanic American Indian % by Zip Code (ZCTA5) — Florida
- Median Age by Zip Code (ZCTA5) — Florida
- U.S. Citizens (% of Population Over 18) by Zip Code (ZCTA5) — Florida
- Population Non-Hispanic White % by Zip Code (ZCTA5) — Florida
- Population Non-Hispanic Black % by Zip Code (ZCTA5) — Florida
- Married Couple (% of all Households) by Zip Code (ZCTA5) — Ohio
- Population Non-Hispanic Asian % by Zip Code (ZCTA5) — California
- Household Median Income by Zip Code (ZCTA5) — Florida
- Household Average Size by Zip Code (ZCTA5) — Connecticut
- Population Non-Hispanic American Indian % by Zip Code (ZCTA5) — Connecticut
- Bachelor's Degree or Higher (% of Over 25) by Zip Code (ZCTA5) — Connecticut
- Housing Median Monthly Rent ($), by Zip Code (ZCTA5) — Nevada
- % of Households with Broadband Internet, by Zip Code (ZCTA5) — Connecticut
- Median Age by Zip Code (ZCTA5) — Iowa
- High School Graduate (% of Over 25) by Zip Code (ZCTA5) — Connecticut
- Household Median Income by Zip Code (ZCTA5) — Iowa
- Population Hispanic % by Zip Code (ZCTA5) — Iowa
- Population Hispanic % by Zip Code (ZCTA5) — Ohio
- Population Hispanic % by Zip Code (ZCTA5) — Idaho
- Population Hispanic % by Zip Code (ZCTA5) — Maine
- Population Hispanic % by Zip Code (ZCTA5) — Texas
- Population Hispanic % by Zip Code (ZCTA5) — Hawaii
- Population Hispanic % by Zip Code (ZCTA5) — Oregon
- Population Hispanic % by Zip Code (ZCTA5) — Nevada
- Population Hispanic % by Zip Code (ZCTA5) — Colorado
- Population Hispanic % by Zip Code (ZCTA5) — Kansas