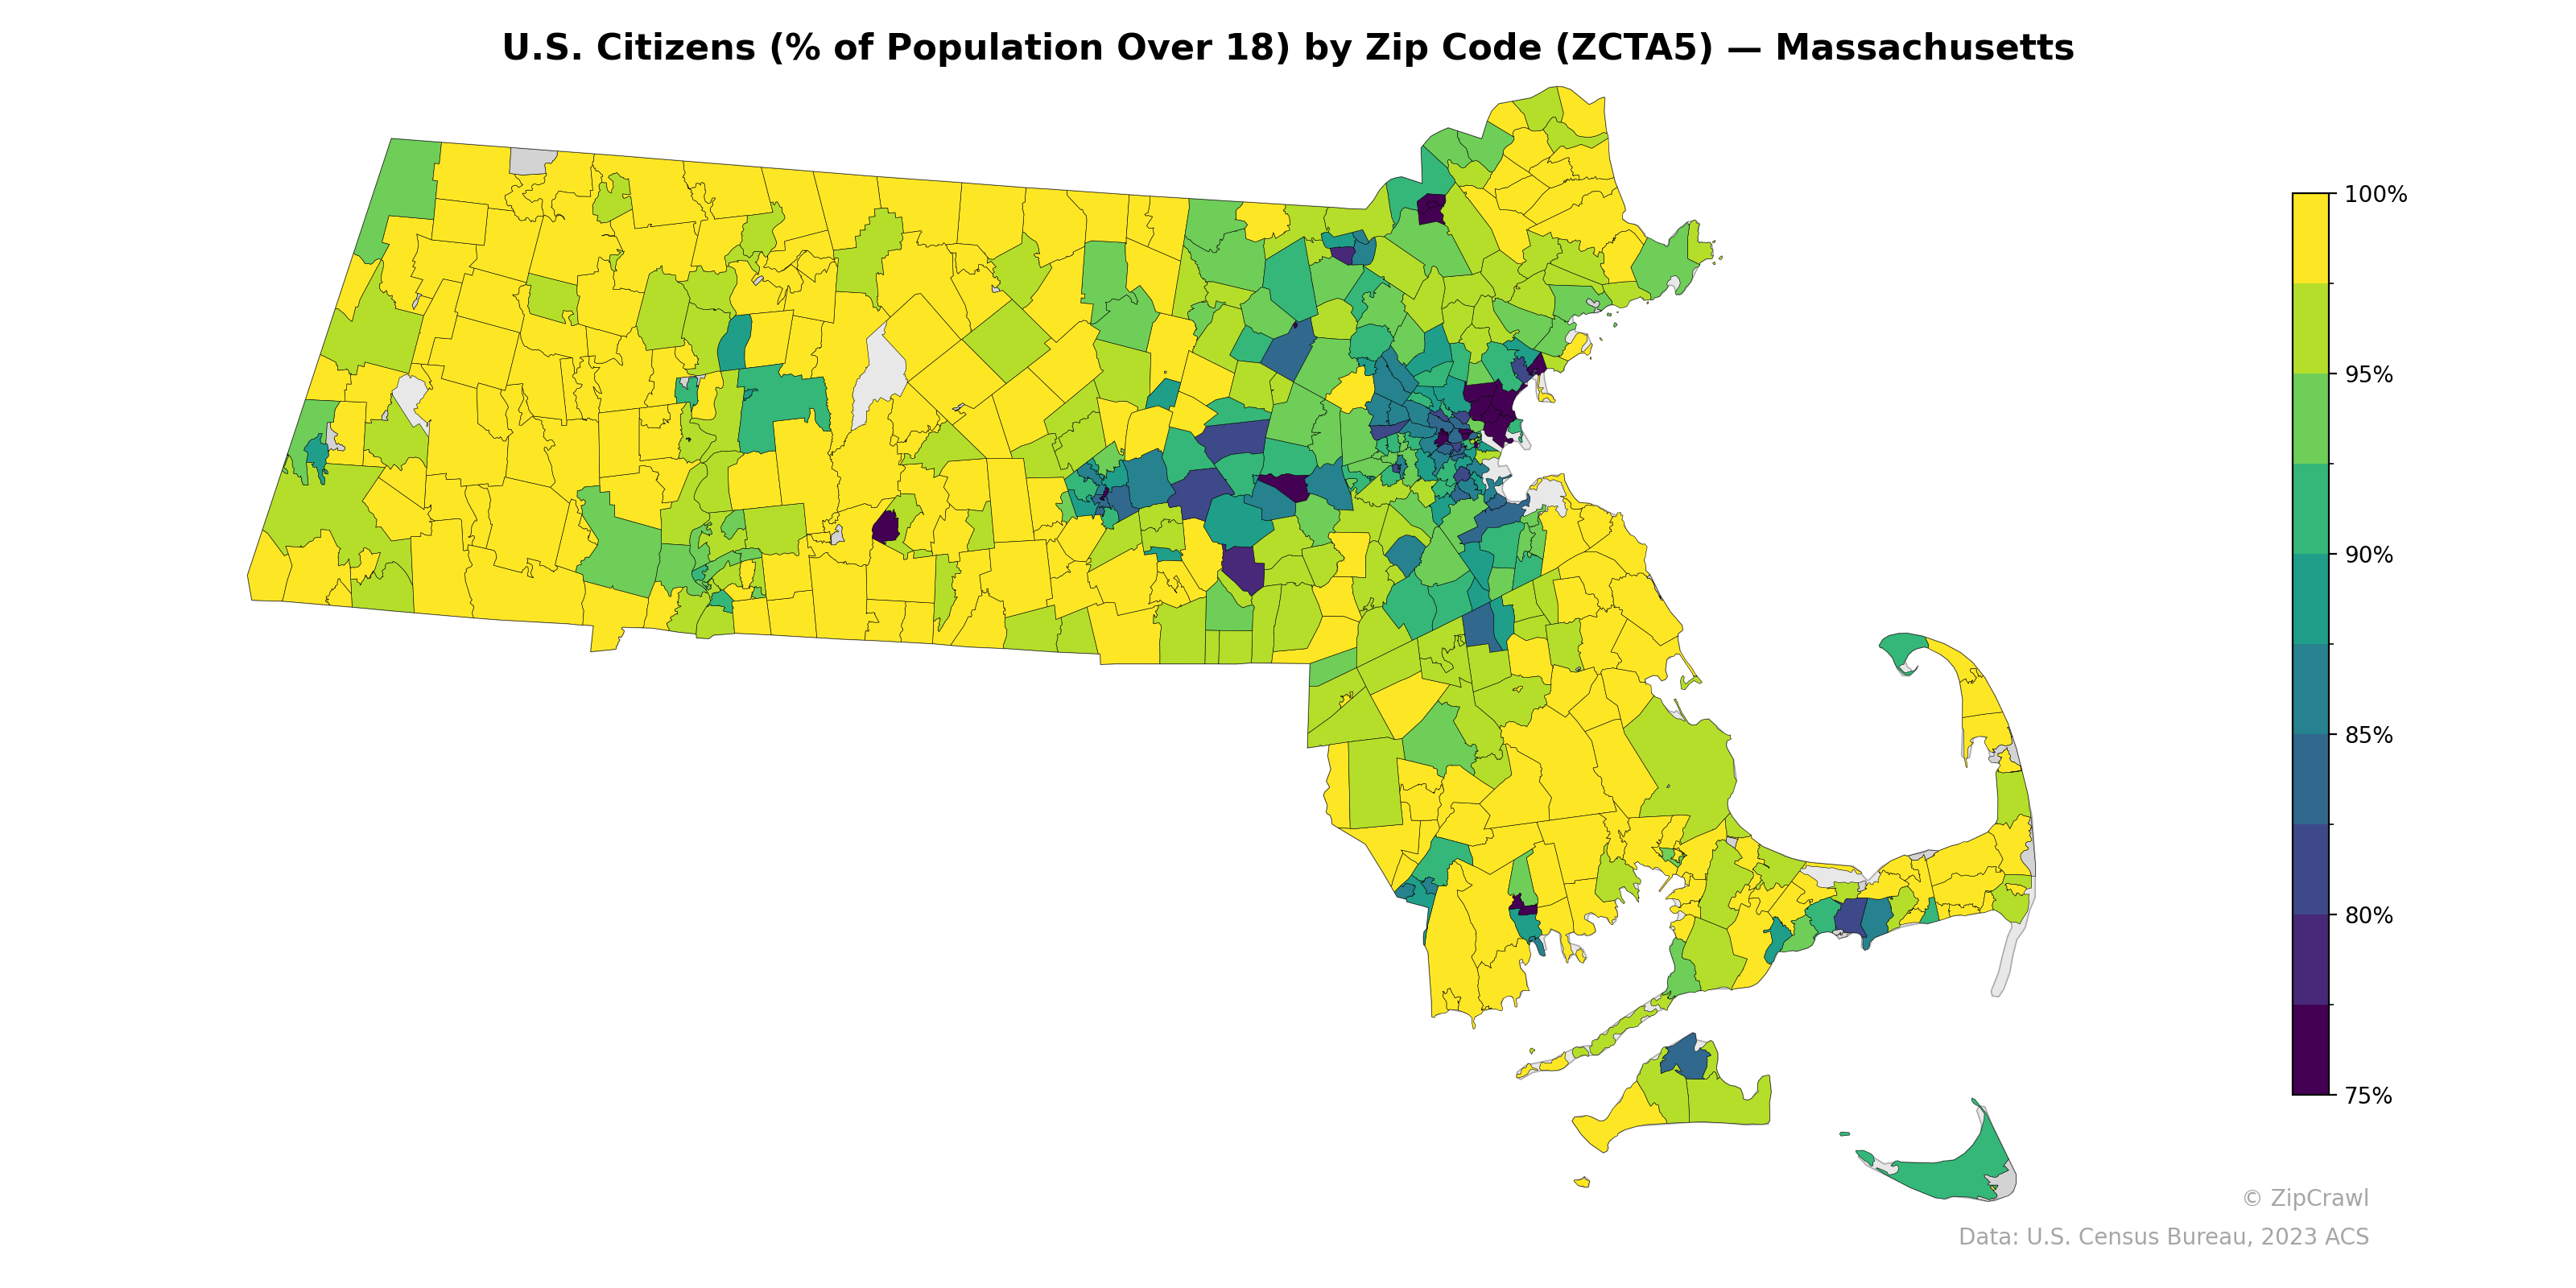
NOTE: Gray indicates insufficient data or a suppressed estimate.
The Greater Boston metro area exhibits the lowest U.S. citizenship rates among adults, with several zip codes in and around Boston, Cambridge, and surrounding communities falling below 85%, likely reflecting concentrations of immigrant populations in urban centers. Western and central Massachusetts zip codes consistently display citizenship rates at or near 100%, with the yellow-dominant landscape indicating highly native-born populations across rural and suburban areas. Notable pockets of lower citizenship rates also appear in select southeastern Massachusetts communities near New Bedford and on parts of Cape Cod, as well as a few scattered zip codes in the Pioneer Valley and Worcester County.
Data: U.S. Census Bureau, 2023 ACS
Explore
- % of Population without Health Insurance, by Zip Code (ZCTA5) — Los Angeles Metro
- Population Hispanic % by Zip Code (ZCTA5) — Massachusetts
- % of Population on Food Stamps or SNAP (Last 12 Months), by Zip Code (ZCTA5) — Tennessee
- Population Non-Hispanic Black % by Zip Code (ZCTA5) — Massachusetts
- Household Median Income by Zip Code (ZCTA5) — Massachusetts
- Population Non-Hispanic White % by Zip Code (ZCTA5) — Massachusetts
- Population Non-Hispanic American Indian % by Zip Code (ZCTA5) — Massachusetts
- High School Graduate (% of Over 25) by Zip Code (ZCTA5) — Massachusetts
- Population Non-Hispanic Asian % by Zip Code (ZCTA5) — Tennessee
- Median Age by Zip Code (ZCTA5) — Massachusetts
- Bachelor's Degree or Higher (% of Over 25) by Zip Code (ZCTA5) — Delaware
- Population Non-Hispanic Black % by County
- Married Couple (% of all Households) by Zip Code (ZCTA5) — Los Angeles Metro
- Housing % of Units Built Since 2010, by Zip Code (ZCTA5) — Los Angeles Metro
- Household Average Size by Zip Code (ZCTA5) — Los Angeles Metro
- Housing Owner-Occupied % of Units, by Zip Code (ZCTA5) — Los Angeles Metro
- Housing Owner-Occupied Median Value ($), by Zip Code (ZCTA5) — Los Angeles Metro
- Bachelor's Degree or Higher (% of Over 25) by Zip Code (ZCTA5) — Los Angeles Metro
- Household Median Income by Zip Code (ZCTA5) — New York Metro
- % of Households with Broadband Internet, by Zip Code (ZCTA5) — Los Angeles Metro
- Housing Median Monthly Rent ($), by Zip Code (ZCTA5) — Los Angeles Metro
- Housing Vacancy Rate by Zip Code (ZCTA5) — Los Angeles Metro
- Housing Owner-Occupied Median Value ($), by Zip Code (ZCTA5) — Tennessee
- % of Population without Health Insurance, by Zip Code (ZCTA5) — Tennessee
- Housing Median Monthly Rent ($), by Zip Code (ZCTA5) — Tennessee
- Population Non-Hispanic Black % by Zip Code (ZCTA5) — Tennessee
- Bachelor's Degree or Higher (% of Over 25) by Zip Code (ZCTA5) — Tennessee
- % of Households with Broadband Internet, by Zip Code (ZCTA5) — Tennessee
- Housing Owner-Occupied % of Units, by Zip Code (ZCTA5) — Tennessee
- Population Hispanic % by Zip Code (ZCTA5) — Tennessee
- U.S. Citizens (% of Population Over 18) by Zip Code (ZCTA5) — Maine
- U.S. Citizens (% of Population Over 18) by Zip Code (ZCTA5) — Ohio
- U.S. Citizens (% of Population Over 18) by Zip Code (ZCTA5) — Utah
- U.S. Citizens (% of Population Over 18) by Zip Code (ZCTA5) — Maryland
- U.S. Citizens (% of Population Over 18) by Zip Code (ZCTA5) — Iowa
- U.S. Citizens (% of Population Over 18) by Zip Code (ZCTA5) — Oregon
- U.S. Citizens (% of Population Over 18) by Zip Code (ZCTA5) — Montana
- U.S. Citizens (% of Population Over 18) by Zip Code (ZCTA5) — Texas
- U.S. Citizens (% of Population Over 18) by Zip Code (ZCTA5) — Idaho
- U.S. Citizens (% of Population Over 18) by Zip Code (ZCTA5) — Michigan