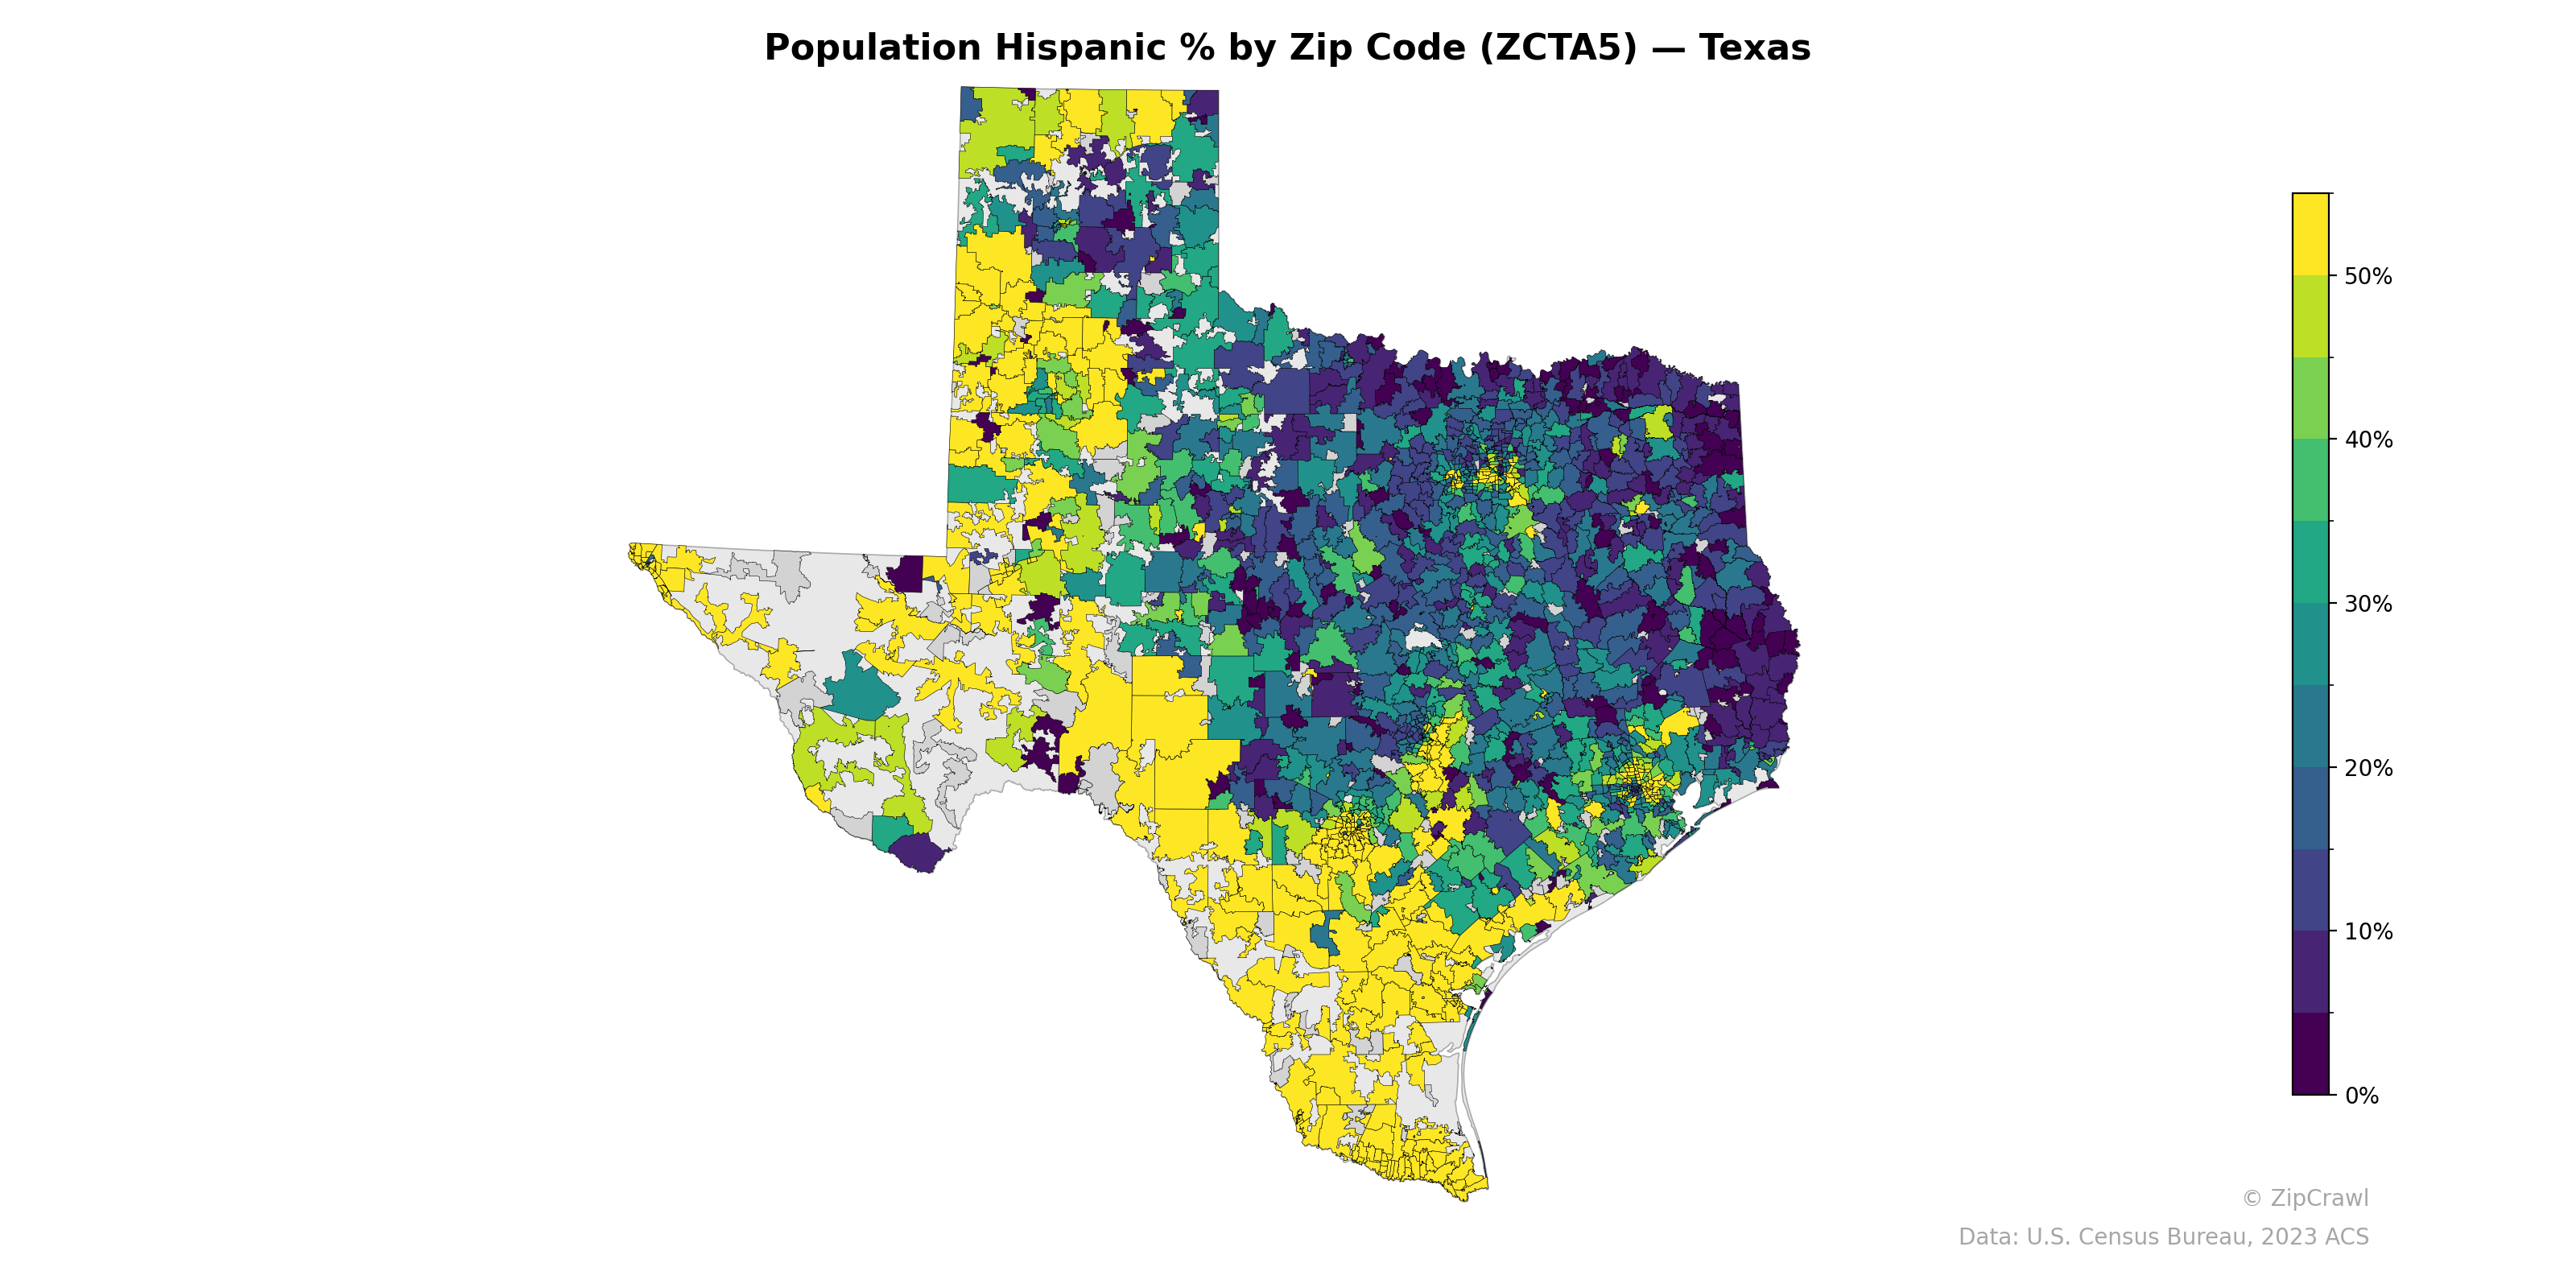
NOTE: Gray indicates insufficient data or a suppressed estimate.
Hispanic population percentages are highest along the Texas-Mexico border region and throughout South Texas, where many zip codes exceed 50%, reflecting the deep historical and cultural ties to Mexico in the Rio Grande Valley and Laredo corridors. The western Panhandle also displays elevated Hispanic concentrations, likely driven by agricultural communities, while East Texas and parts of the Dallas-Fort Worth suburban fringe show notably lower percentages, often below 10-15%. A clear gradient emerges moving from the southern and western periphery inward toward the eastern half of the state, with major metro areas like Houston, San Antonio, and Dallas exhibiting internal heterogeneity with sharp contrasts between adjacent zip codes.
Data: U.S. Census Bureau, 2023 ACS
Explore
- % of Population on Food Stamps or SNAP (Last 12 Months), by Zip Code (ZCTA5) — San Antonio Metro
- Household Median Income by Zip Code (ZCTA5) — Austin Metro
- Population Non-Hispanic Asian % by Zip Code (ZCTA5) — San Antonio Metro
- Population Non-Hispanic American Indian % by Zip Code (ZCTA5) — Austin Metro
- High School Graduate (% of Over 25) by Zip Code (ZCTA5) — Austin Metro
- Median Age by Zip Code (ZCTA5) — Austin Metro
- U.S. Citizens (% of Population Over 18) by Zip Code (ZCTA5) — Austin Metro
- Population Non-Hispanic Black % by Zip Code (ZCTA5) — Austin Metro
- Population Non-Hispanic White % by Zip Code (ZCTA5) — Austin Metro
- High School Graduate (% of Over 25) by County
- Population Non-Hispanic White % by Zip Code (ZCTA5) — Texas
- U.S. Citizens (% of Population Over 18) by Zip Code (ZCTA5) — Texas
- Population Non-Hispanic Asian % by Zip Code (ZCTA5) — Chicago Metro
- Household Median Income by Zip Code (ZCTA5) — Texas
- Median Age by Zip Code (ZCTA5) — Texas
- Population Non-Hispanic Black % by Zip Code (ZCTA5) — Texas
- Population Non-Hispanic American Indian % by Zip Code (ZCTA5) — Texas
- High School Graduate (% of Over 25) by Zip Code (ZCTA5) — Texas
- % of Population on Food Stamps or SNAP (Last 12 Months), by Zip Code (ZCTA5) — Chicago Metro
- Housing Owner-Occupied Median Value ($), by Zip Code (ZCTA5) — Baltimore Metro
- % of Population without Health Insurance, by Zip Code (ZCTA5) — Baltimore Metro
- Housing Median Monthly Rent ($), by Zip Code (ZCTA5) — Baltimore Metro
- Household Median Income by Zip Code (ZCTA5) — Baltimore Metro
- Bachelor's Degree or Higher (% of Over 25) by Zip Code (ZCTA5) — Baltimore Metro
- % of Population on Food Stamps or SNAP (Last 12 Months), by Zip Code (ZCTA5) — Charlotte Metro
- High School Graduate (% of Over 25) by Zip Code (ZCTA5) — Baltimore Metro
- Population Non-Hispanic Asian % by Zip Code (ZCTA5) — Charlotte Metro
- U.S. Citizens (% of Population Over 18) by Zip Code (ZCTA5) — Baltimore Metro
- Housing Owner-Occupied % of Units, by Zip Code (ZCTA5) — Baltimore Metro
- % of Households with Broadband Internet, by Zip Code (ZCTA5) — Baltimore Metro
- Population Hispanic % by Zip Code (ZCTA5) — Kansas
- Population Hispanic % by Zip Code (ZCTA5) — Iowa
- Population Hispanic % by Zip Code (ZCTA5) — Ohio
- Population Hispanic % by Zip Code (ZCTA5) — Utah
- Population Hispanic % by Zip Code (ZCTA5) — Tennessee
- Population Hispanic % by Zip Code (ZCTA5) — Idaho
- Population Hispanic % by Zip Code (ZCTA5) — Maine
- Population Hispanic % by Zip Code (ZCTA5) — Oregon
- Population Hispanic % by Zip Code (ZCTA5) — Hawaii
- Population Hispanic % by Zip Code (ZCTA5) — Arkansas