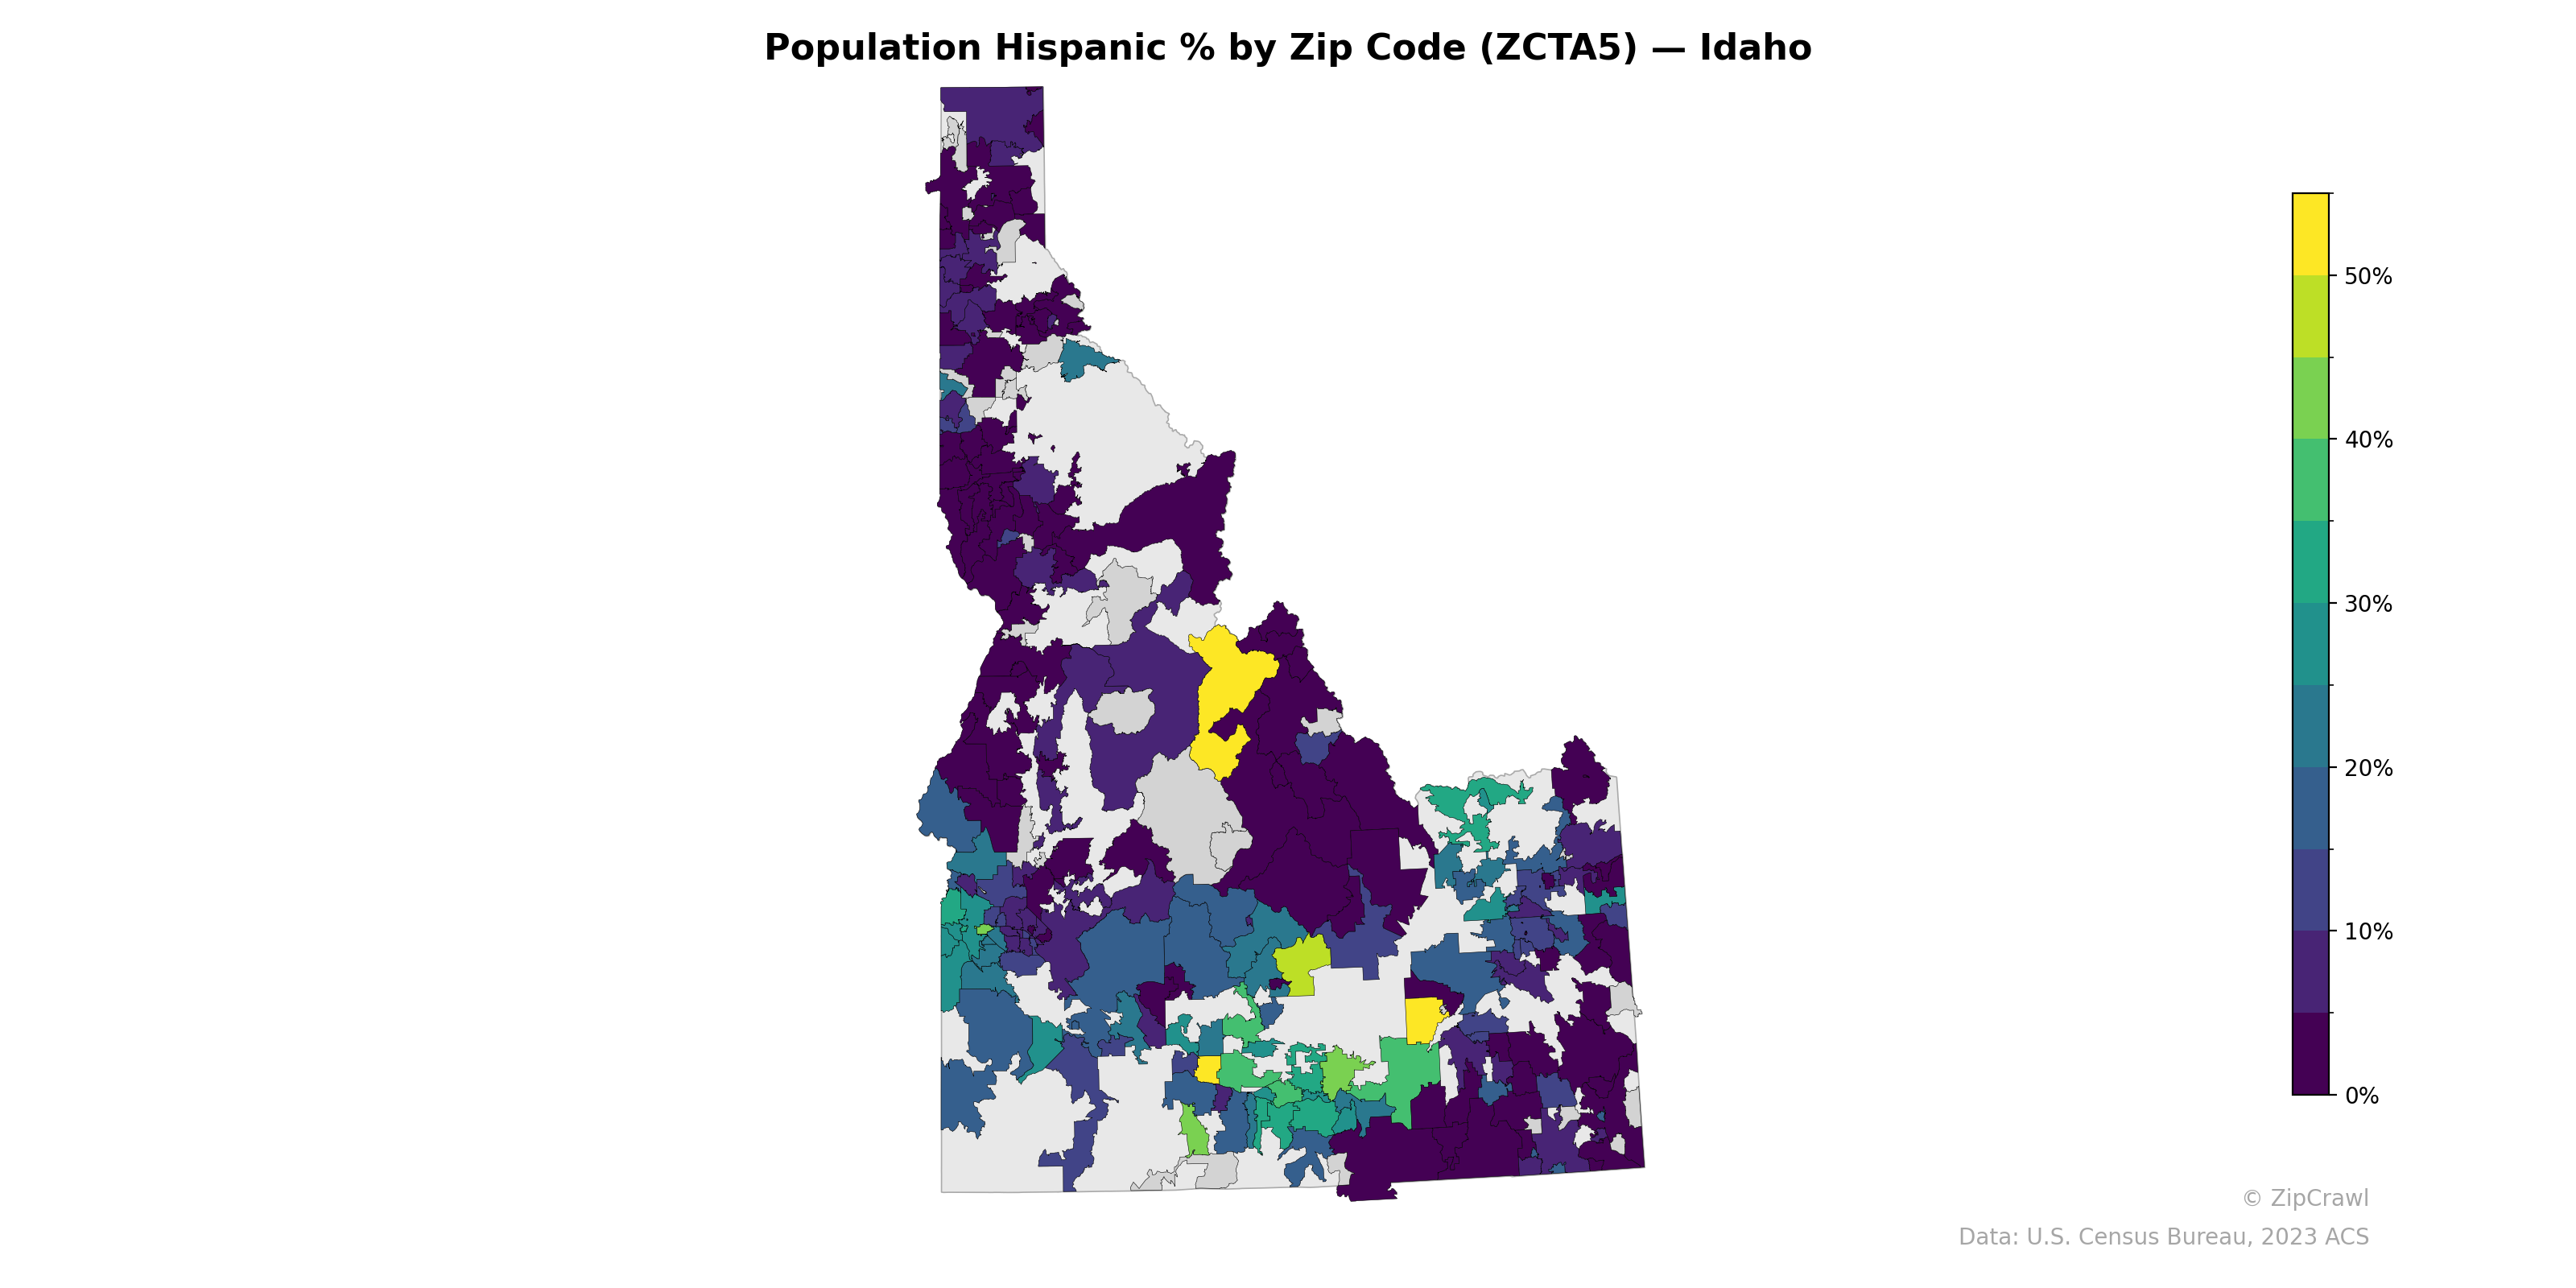
NOTE: Gray indicates insufficient data or a suppressed estimate.
Hispanic population concentrations in Idaho are most pronounced in the south-central Magic Valley region and parts of the western Snake River Plain, where several zip codes exceed 30–50%, likely corresponding to agricultural communities around Twin Falls, Jerome, and Caldwell/Nampa. The northern panhandle and central mountain regions consistently register among the lowest Hispanic percentages statewide, generally below 5%, reflecting the rural, less agriculturally intensive character of those areas. A notable cluster of elevated Hispanic population also appears in the Boise metropolitan area's western suburbs, contrasting sharply with the very low percentages in adjacent foothill and mountain zip codes to the north and east.
Data: U.S. Census Bureau, 2023 ACS
Explore
- Household Average Size by Zip Code (ZCTA5) — Florida
- Population Non-Hispanic Black % by Zip Code (ZCTA5) — Idaho
- Household Median Income by Zip Code (ZCTA5) — Idaho
- Population Non-Hispanic Asian % by Zip Code (ZCTA5) — Nebraska
- Married Couple (% of all Households) by Zip Code (ZCTA5) — Nebraska
- % of Population on Food Stamps or SNAP (Last 12 Months), by Zip Code (ZCTA5) — Nebraska
- Population Non-Hispanic White % by Zip Code (ZCTA5) — Idaho
- U.S. Citizens (% of Population Over 18) by Zip Code (ZCTA5) — Idaho
- Median Age by Zip Code (ZCTA5) — Idaho
- Housing Vacancy Rate by Zip Code (ZCTA5) — Nebraska
- Housing Median Monthly Rent ($), by County
- Married Couple (% of all Households) by Zip Code (ZCTA5) — Illinois
- Housing Vacancy Rate by Zip Code (ZCTA5) — Florida
- Married Couple (% of all Households) by Zip Code (ZCTA5) — Florida
- Married Couple (% of all Households) by Zip Code (ZCTA5) — Washington D.C. Metro
- Housing Owner-Occupied Median Value ($), by Zip Code (ZCTA5) — Florida
- % of Population without Health Insurance, by Zip Code (ZCTA5) — Florida
- Housing Median Monthly Rent ($), by Zip Code (ZCTA5) — Florida
- Bachelor's Degree or Higher (% of Over 25) by Zip Code (ZCTA5) — Florida
- % of Households with Broadband Internet, by Zip Code (ZCTA5) — Florida
- Housing % of Units Built Since 2010, by Zip Code (ZCTA5) — Florida
- Housing Owner-Occupied % of Units, by Zip Code (ZCTA5) — Florida
- Housing Vacancy Rate by Zip Code (ZCTA5) — Mississippi
- Bachelor's Degree or Higher (% of Over 25) by Zip Code (ZCTA5) — Mississippi
- Population Non-Hispanic Asian % by Zip Code (ZCTA5) — Mississippi
- % of Households with Broadband Internet, by Zip Code (ZCTA5) — Mississippi
- Population Non-Hispanic American Indian % by Zip Code (ZCTA5) — Mississippi
- Married Couple (% of all Households) by Zip Code (ZCTA5) — Mississippi
- High School Graduate (% of Over 25) by Zip Code (ZCTA5) — Mississippi
- % of Population on Food Stamps or SNAP (Last 12 Months), by Zip Code (ZCTA5) — Mississippi
- Population Hispanic % by Zip Code (ZCTA5) — Iowa
- Population Hispanic % by Zip Code (ZCTA5) — Ohio
- Population Hispanic % by Zip Code (ZCTA5) — Utah
- Population Hispanic % by Zip Code (ZCTA5) — Florida
- Population Hispanic % by Zip Code (ZCTA5) — Indiana
- Population Hispanic % by Zip Code (ZCTA5) — Texas
- Population Hispanic % by Zip Code (ZCTA5) — Maine
- Population Hispanic % by Zip Code (ZCTA5) — Oregon
- Population Hispanic % by Zip Code (ZCTA5) — Hawaii
- Population Hispanic % by Zip Code (ZCTA5) — Illinois