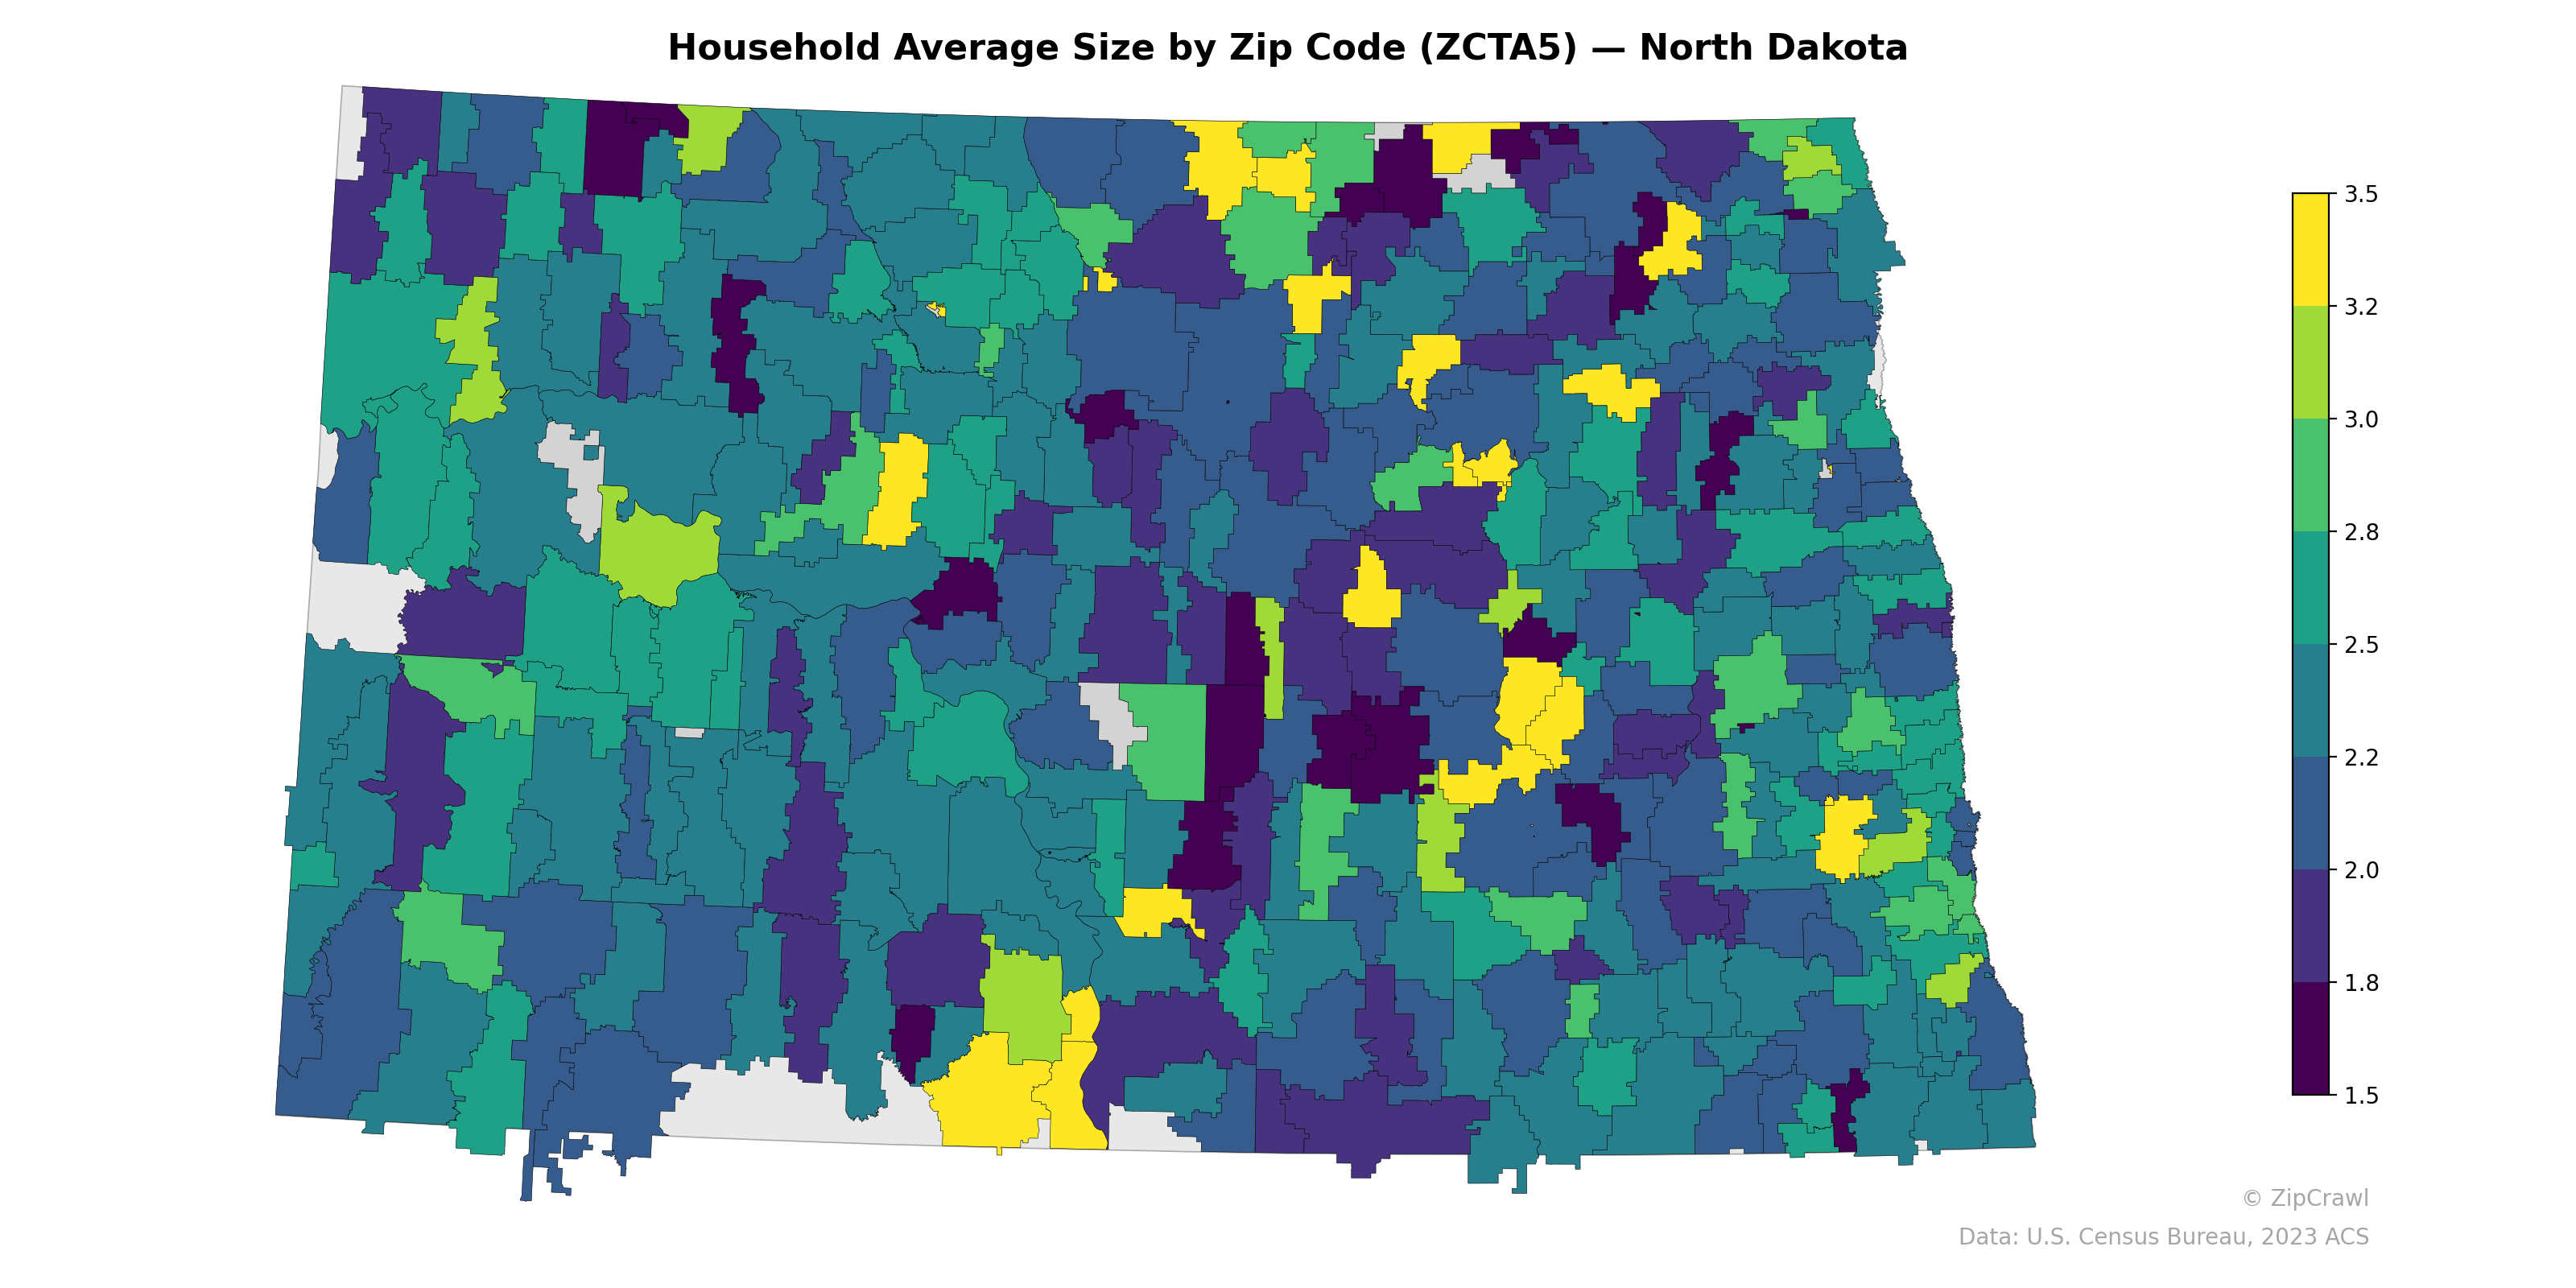
NOTE: Gray indicates insufficient data or a suppressed estimate.
Household sizes across North Dakota exhibit considerable spatial variation, with several bright yellow clusters indicating average sizes above 3.0 concentrated in the north-central region and scattered through the south-central portion of the state, likely corresponding to areas with larger families or tribal lands such as the Fort Berthold and Standing Rock reservations. The darkest purple zones, reflecting averages near 1.5–1.8, appear in pockets that likely align with college towns and smaller communities with older populations, including areas around Grand Forks and smaller rural centers. The western oil patch region around Williston trends toward moderate household sizes in the 2.4–2.8 range, while the southeastern quadrant displays a relatively mixed pattern without dominant clustering.
Data: U.S. Census Bureau, 2023 ACS
Explore
- Housing % of Units Built Since 2010, by Zip Code (ZCTA5) — New York
- Housing Owner-Occupied % of Units, by Zip Code (ZCTA5) — North Dakota
- % of Households with Broadband Internet, by Zip Code (ZCTA5) — North Dakota
- High School Graduate (% of Over 25) by Zip Code (ZCTA5) — North Dakota
- Population Non-Hispanic American Indian % by Zip Code (ZCTA5) — North Dakota
- Housing % of Units Built Since 2010, by Zip Code (ZCTA5) — North Dakota
- % of Population without Health Insurance, by Zip Code (ZCTA5) — North Dakota
- Housing Owner-Occupied Median Value ($), by Zip Code (ZCTA5) — North Dakota
- Housing Median Monthly Rent ($), by Zip Code (ZCTA5) — North Dakota
- Bachelor's Degree or Higher (% of Over 25) by Zip Code (ZCTA5) — North Dakota
- Housing Owner-Occupied % of Units, by Zip Code (ZCTA5) — New York
- High School Graduate (% of Over 25) by Zip Code (ZCTA5) — Missouri
- Married Couple (% of all Households) by Zip Code (ZCTA5) — New York
- High School Graduate (% of Over 25) by Zip Code (ZCTA5) — Illinois
- Housing Owner-Occupied Median Value ($), by Zip Code (ZCTA5) — New York
- Housing Median Monthly Rent ($), by Zip Code (ZCTA5) — New York
- % of Population without Health Insurance, by Zip Code (ZCTA5) — New York
- Housing Vacancy Rate by Zip Code (ZCTA5) — New York
- Bachelor's Degree or Higher (% of Over 25) by Zip Code (ZCTA5) — New York
- % of Households with Broadband Internet, by Zip Code (ZCTA5) — New York
- Housing Vacancy Rate by Zip Code (ZCTA5) — Rhode Island
- High School Graduate (% of Over 25) by Zip Code (ZCTA5) — Rhode Island
- Population Non-Hispanic Asian % by Zip Code (ZCTA5) — Rhode Island
- Median Age by Zip Code (ZCTA5) — Oregon
- Bachelor's Degree or Higher (% of Over 25) by Zip Code (ZCTA5) — Rhode Island
- Population Non-Hispanic Black % by Zip Code (ZCTA5) — North Dakota
- Married Couple (% of all Households) by Zip Code (ZCTA5) — Rhode Island
- Housing Vacancy Rate by Zip Code (ZCTA5) — Alaska
- Population Non-Hispanic American Indian % by Zip Code (ZCTA5) — Rhode Island
- % of Population on Food Stamps or SNAP (Last 12 Months), by Zip Code (ZCTA5) — Rhode Island
- Household Average Size by Zip Code (ZCTA5) — South Dakota
- Household Average Size by Zip Code (ZCTA5) — North Carolina
- Household Average Size by Zip Code (ZCTA5) — Nevada
- Household Average Size by Zip Code (ZCTA5) — Iowa
- Household Average Size by Zip Code (ZCTA5) — Ohio
- Household Average Size by Zip Code (ZCTA5) — Utah
- Household Average Size by Zip Code (ZCTA5) — Minnesota
- Household Average Size by Zip Code (ZCTA5) — Hawaii
- Household Average Size by Zip Code (ZCTA5) — Texas
- Household Average Size by Zip Code (ZCTA5) — Idaho