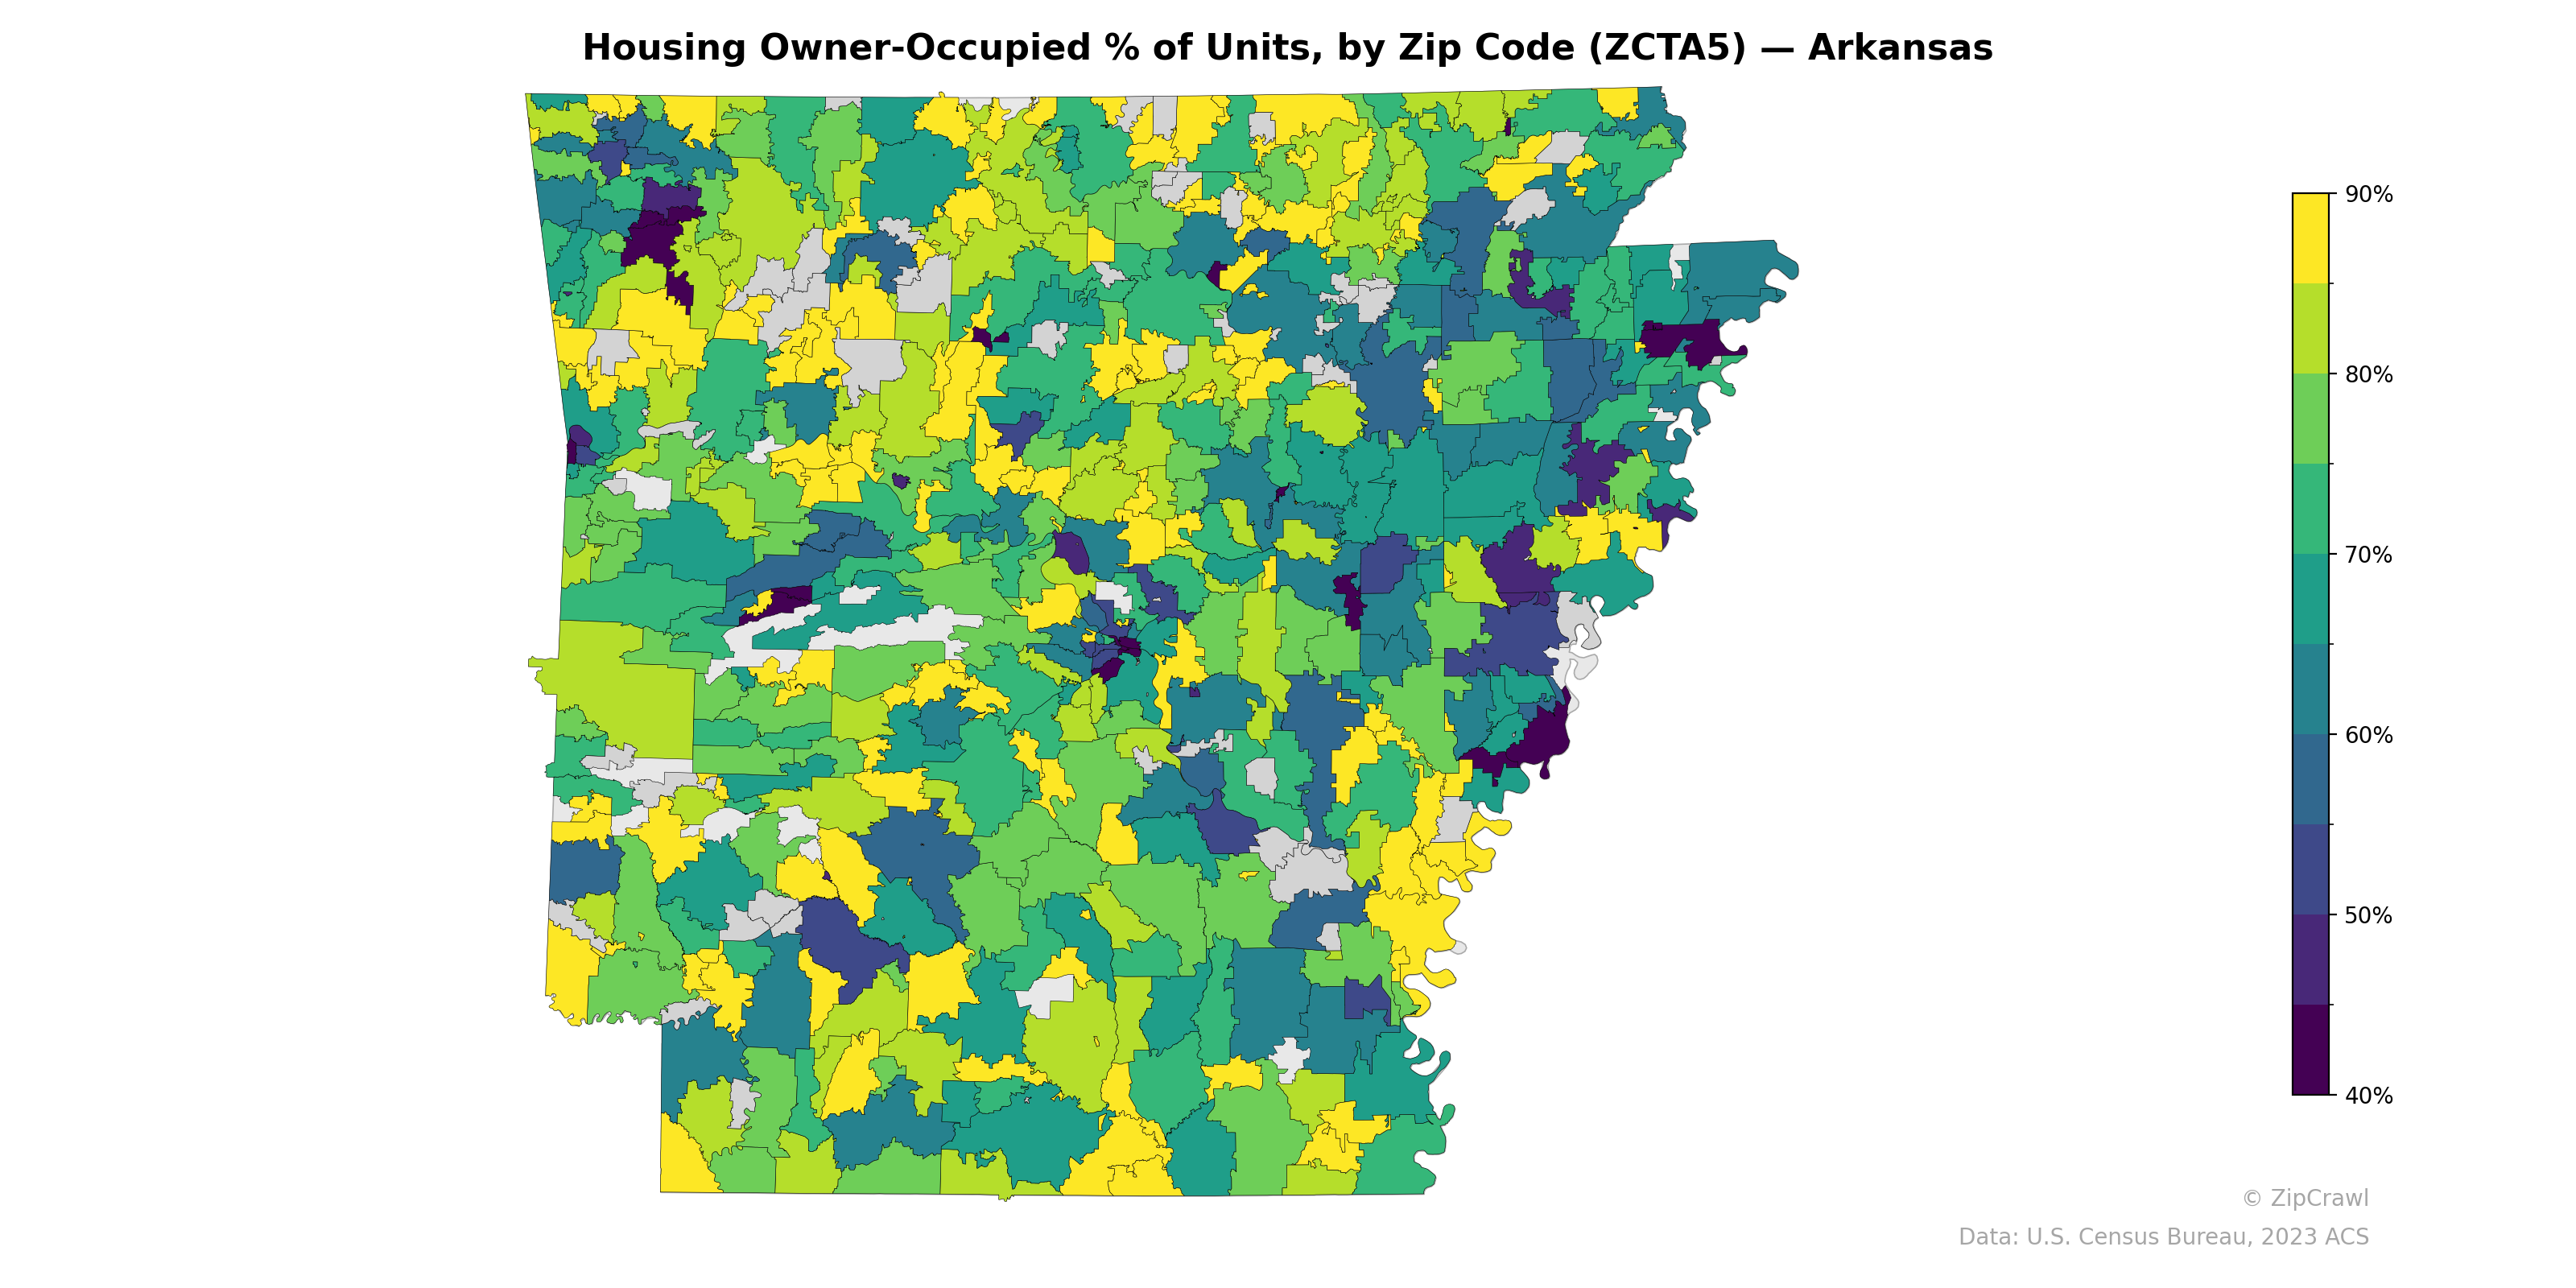
NOTE: Gray indicates insufficient data or a suppressed estimate.
Owner-occupancy rates across Arkansas zip codes display a clear urban-rural divide, with the lowest concentrations (below 50%) clustered in and around Little Rock, Jonesboro, Pine Bluff, and the Mississippi Delta region along the eastern border. The northwestern corner of the state, encompassing the Fayetteville-Springdale-Rogers metro area, shows a notably mixed pattern with pockets of both high and moderate owner-occupancy, likely reflecting rapid growth and a substantial renter population tied to the university and corporate employers. Rural zip codes in the Ozarks, Ouachita Mountains, and western portions of the state consistently exhibit the highest owner-occupancy rates, frequently exceeding 80–90%, characteristic of areas with lower housing costs and less multifamily housing stock.
Data: U.S. Census Bureau, 2023 ACS
Explore
- Population Non-Hispanic American Indian % by Zip Code (ZCTA5) — Florida
- Housing Owner-Occupied Median Value ($), by Zip Code (ZCTA5) — Arkansas
- % of Population without Health Insurance, by Zip Code (ZCTA5) — Arkansas
- Population Non-Hispanic American Indian % by Zip Code (ZCTA5) — Arkansas
- Household Average Size by Zip Code (ZCTA5) — Arkansas
- Housing % of Units Built Since 2010, by Zip Code (ZCTA5) — Arkansas
- Housing Median Monthly Rent ($), by Zip Code (ZCTA5) — Arkansas
- % of Households with Broadband Internet, by Zip Code (ZCTA5) — Arkansas
- High School Graduate (% of Over 25) by Zip Code (ZCTA5) — Arkansas
- Bachelor's Degree or Higher (% of Over 25) by Zip Code (ZCTA5) — Arkansas
- Housing Owner-Occupied Median Value ($), by County
- Population Non-Hispanic White % by Zip Code (ZCTA5) — Miami Metro
- High School Graduate (% of Over 25) by Zip Code (ZCTA5) — Florida
- Population Non-Hispanic White % by Zip Code (ZCTA5) — Florida
- Household Median Income by Zip Code (ZCTA5) — Florida
- Population Hispanic % by Zip Code (ZCTA5) — Florida
- Population Non-Hispanic Asian % by Zip Code (ZCTA5) — California
- % of Population on Food Stamps or SNAP (Last 12 Months), by Zip Code (ZCTA5) — California
- Population Non-Hispanic White % by Zip Code (ZCTA5) — Pennsylvania
- U.S. Citizens (% of Population Over 18) by Zip Code (ZCTA5) — Florida
- Population Non-Hispanic Black % by Zip Code (ZCTA5) — Florida
- Median Age by Zip Code (ZCTA5) — Florida
- Household Average Size by Zip Code (ZCTA5) — Connecticut
- Population Non-Hispanic American Indian % by Zip Code (ZCTA5) — Connecticut
- Married Couple (% of all Households) by Zip Code (ZCTA5) — Connecticut
- Housing Median Monthly Rent ($), by Zip Code (ZCTA5) — Nevada
- Median Age by Zip Code (ZCTA5) — Iowa
- Population Hispanic % by Zip Code (ZCTA5) — Mississippi
- Housing % of Units Built Since 2010, by Zip Code (ZCTA5) — Connecticut
- High School Graduate (% of Over 25) by Zip Code (ZCTA5) — Connecticut
- Housing Owner-Occupied % of Units, by Zip Code (ZCTA5) — Kansas
- Housing Owner-Occupied % of Units, by Zip Code (ZCTA5) — Arizona
- Housing Owner-Occupied % of Units, by Zip Code (ZCTA5) — Texas
- Housing Owner-Occupied % of Units, by Zip Code (ZCTA5) — Utah
- Housing Owner-Occupied % of Units, by Zip Code (ZCTA5) — Ohio
- Housing Owner-Occupied % of Units, by Zip Code (ZCTA5) — Alaska
- Housing Owner-Occupied % of Units, by Zip Code (ZCTA5) — Iowa
- Housing Owner-Occupied % of Units, by Zip Code (ZCTA5) — Alabama
- Housing Owner-Occupied % of Units, by Zip Code (ZCTA5) — Oregon
- Housing Owner-Occupied % of Units, by Zip Code (ZCTA5) — Idaho