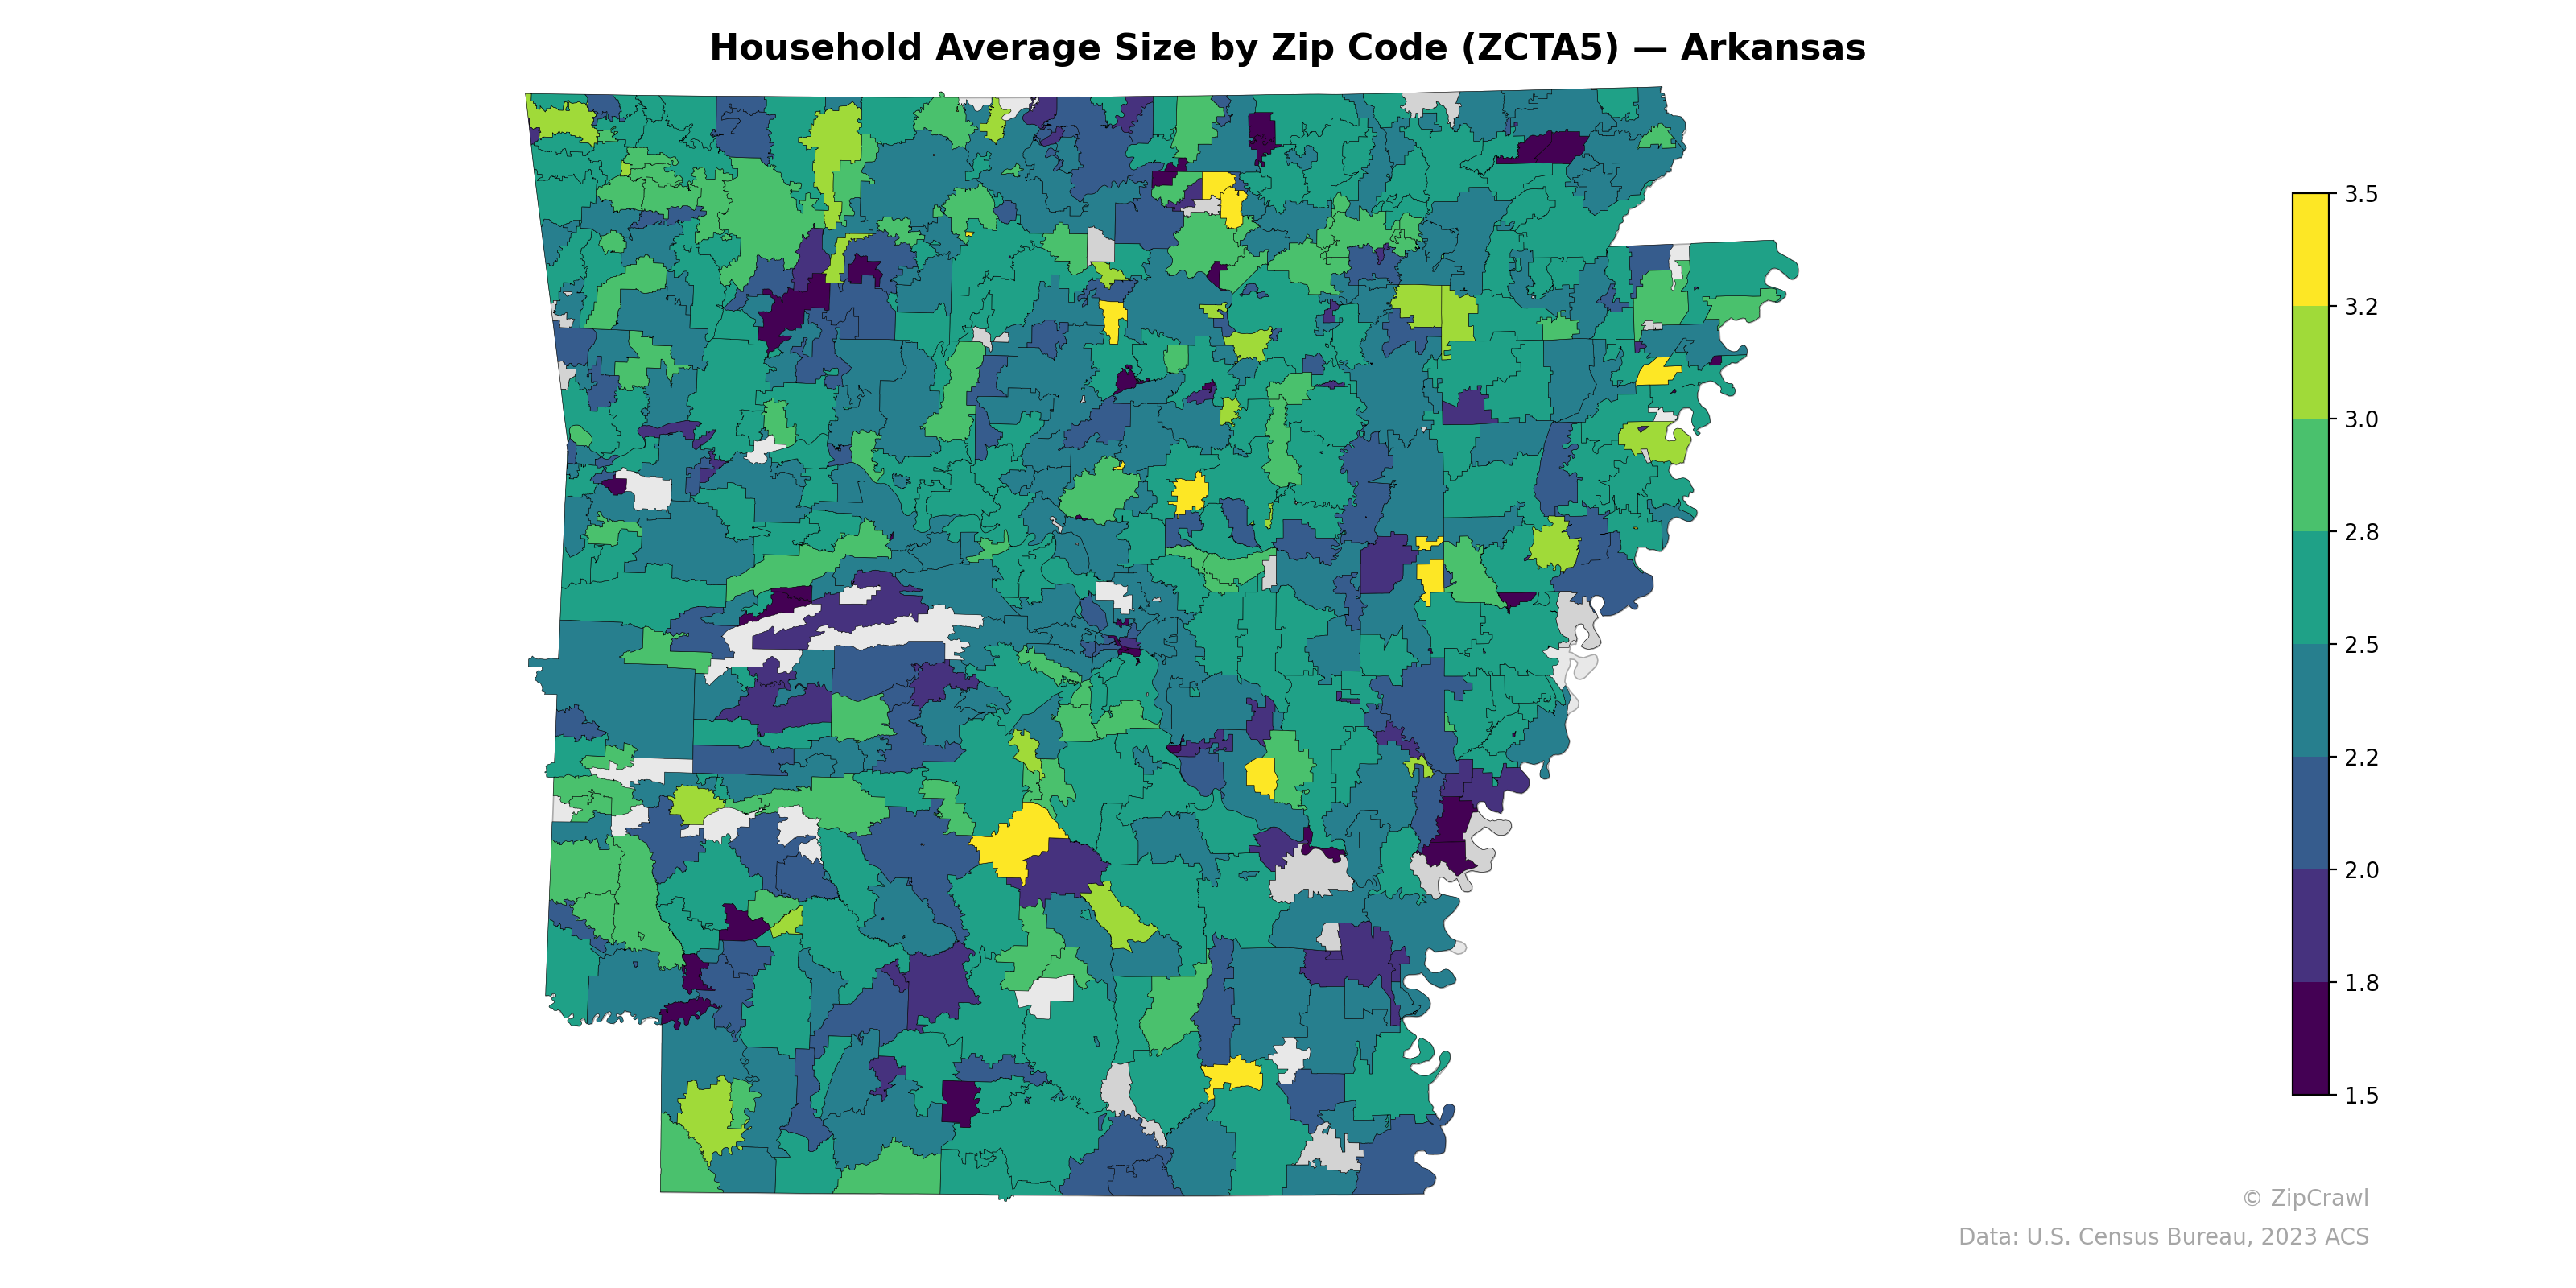
NOTE: Gray indicates insufficient data or a suppressed estimate.
Northwest Arkansas zip codes, particularly in the Benton and Washington County corridor, display consistently higher average household sizes (3.0–3.5+), likely reflecting the region's rapid family-oriented suburban growth tied to major employers like Walmart, Tyson, and J.B. Hunt. In contrast, scattered zip codes across the south-central and eastern Delta regions show notably lower averages (1.5–2.0), corresponding to areas with aging populations, higher poverty rates, and persistent out-migration. Urban cores such as Little Rock and college towns like Fayetteville and Jonesboro contain pockets of smaller household sizes surrounded by larger-household suburban rings, illustrating a classic urban-suburban demographic gradient.
Data: U.S. Census Bureau, 2023 ACS
Explore
- Population Non-Hispanic American Indian % by Zip Code (ZCTA5) — Florida
- Housing Median Monthly Rent ($), by Zip Code (ZCTA5) — Arkansas
- Housing Owner-Occupied % of Units, by Zip Code (ZCTA5) — Arkansas
- % of Households with Broadband Internet, by Zip Code (ZCTA5) — Arkansas
- Housing % of Units Built Since 2010, by Zip Code (ZCTA5) — Arkansas
- Population Non-Hispanic American Indian % by Zip Code (ZCTA5) — Arkansas
- Housing Owner-Occupied Median Value ($), by Zip Code (ZCTA5) — Arkansas
- % of Population without Health Insurance, by Zip Code (ZCTA5) — Arkansas
- High School Graduate (% of Over 25) by Zip Code (ZCTA5) — Arkansas
- Bachelor's Degree or Higher (% of Over 25) by Zip Code (ZCTA5) — Arkansas
- Housing Owner-Occupied Median Value ($), by County
- High School Graduate (% of Over 25) by Zip Code (ZCTA5) — Florida
- High School Graduate (% of Over 25) by Zip Code (ZCTA5) — Miami Metro
- Population Non-Hispanic Black % by Zip Code (ZCTA5) — Florida
- Median Age by Zip Code (ZCTA5) — Florida
- U.S. Citizens (% of Population Over 18) by Zip Code (ZCTA5) — Florida
- Population Non-Hispanic White % by Zip Code (ZCTA5) — Florida
- Population Non-Hispanic Asian % by Zip Code (ZCTA5) — California
- % of Population on Food Stamps or SNAP (Last 12 Months), by Zip Code (ZCTA5) — California
- High School Graduate (% of Over 25) by Zip Code (ZCTA5) — Pennsylvania
- Population Hispanic % by Zip Code (ZCTA5) — Florida
- Household Median Income by Zip Code (ZCTA5) — Florida
- Housing % of Units Built Since 2010, by Zip Code (ZCTA5) — Connecticut
- Population Non-Hispanic American Indian % by Zip Code (ZCTA5) — Connecticut
- Married Couple (% of all Households) by Zip Code (ZCTA5) — Connecticut
- Housing Median Monthly Rent ($), by Zip Code (ZCTA5) — Nevada
- Population Hispanic % by Zip Code (ZCTA5) — Mississippi
- Household Median Income by Zip Code (ZCTA5) — Iowa
- Median Age by Zip Code (ZCTA5) — Iowa
- High School Graduate (% of Over 25) by Zip Code (ZCTA5) — Connecticut
- Household Average Size by Zip Code (ZCTA5) — Kansas
- Household Average Size by Zip Code (ZCTA5) — Texas
- Household Average Size by Zip Code (ZCTA5) — Arizona
- Household Average Size by Zip Code (ZCTA5) — Iowa
- Household Average Size by Zip Code (ZCTA5) — Ohio
- Household Average Size by Zip Code (ZCTA5) — Utah
- Household Average Size by Zip Code (ZCTA5) — Hawaii
- Household Average Size by Zip Code (ZCTA5) — Maine
- Household Average Size by Zip Code (ZCTA5) — Idaho
- Household Average Size by Zip Code (ZCTA5) — Alaska