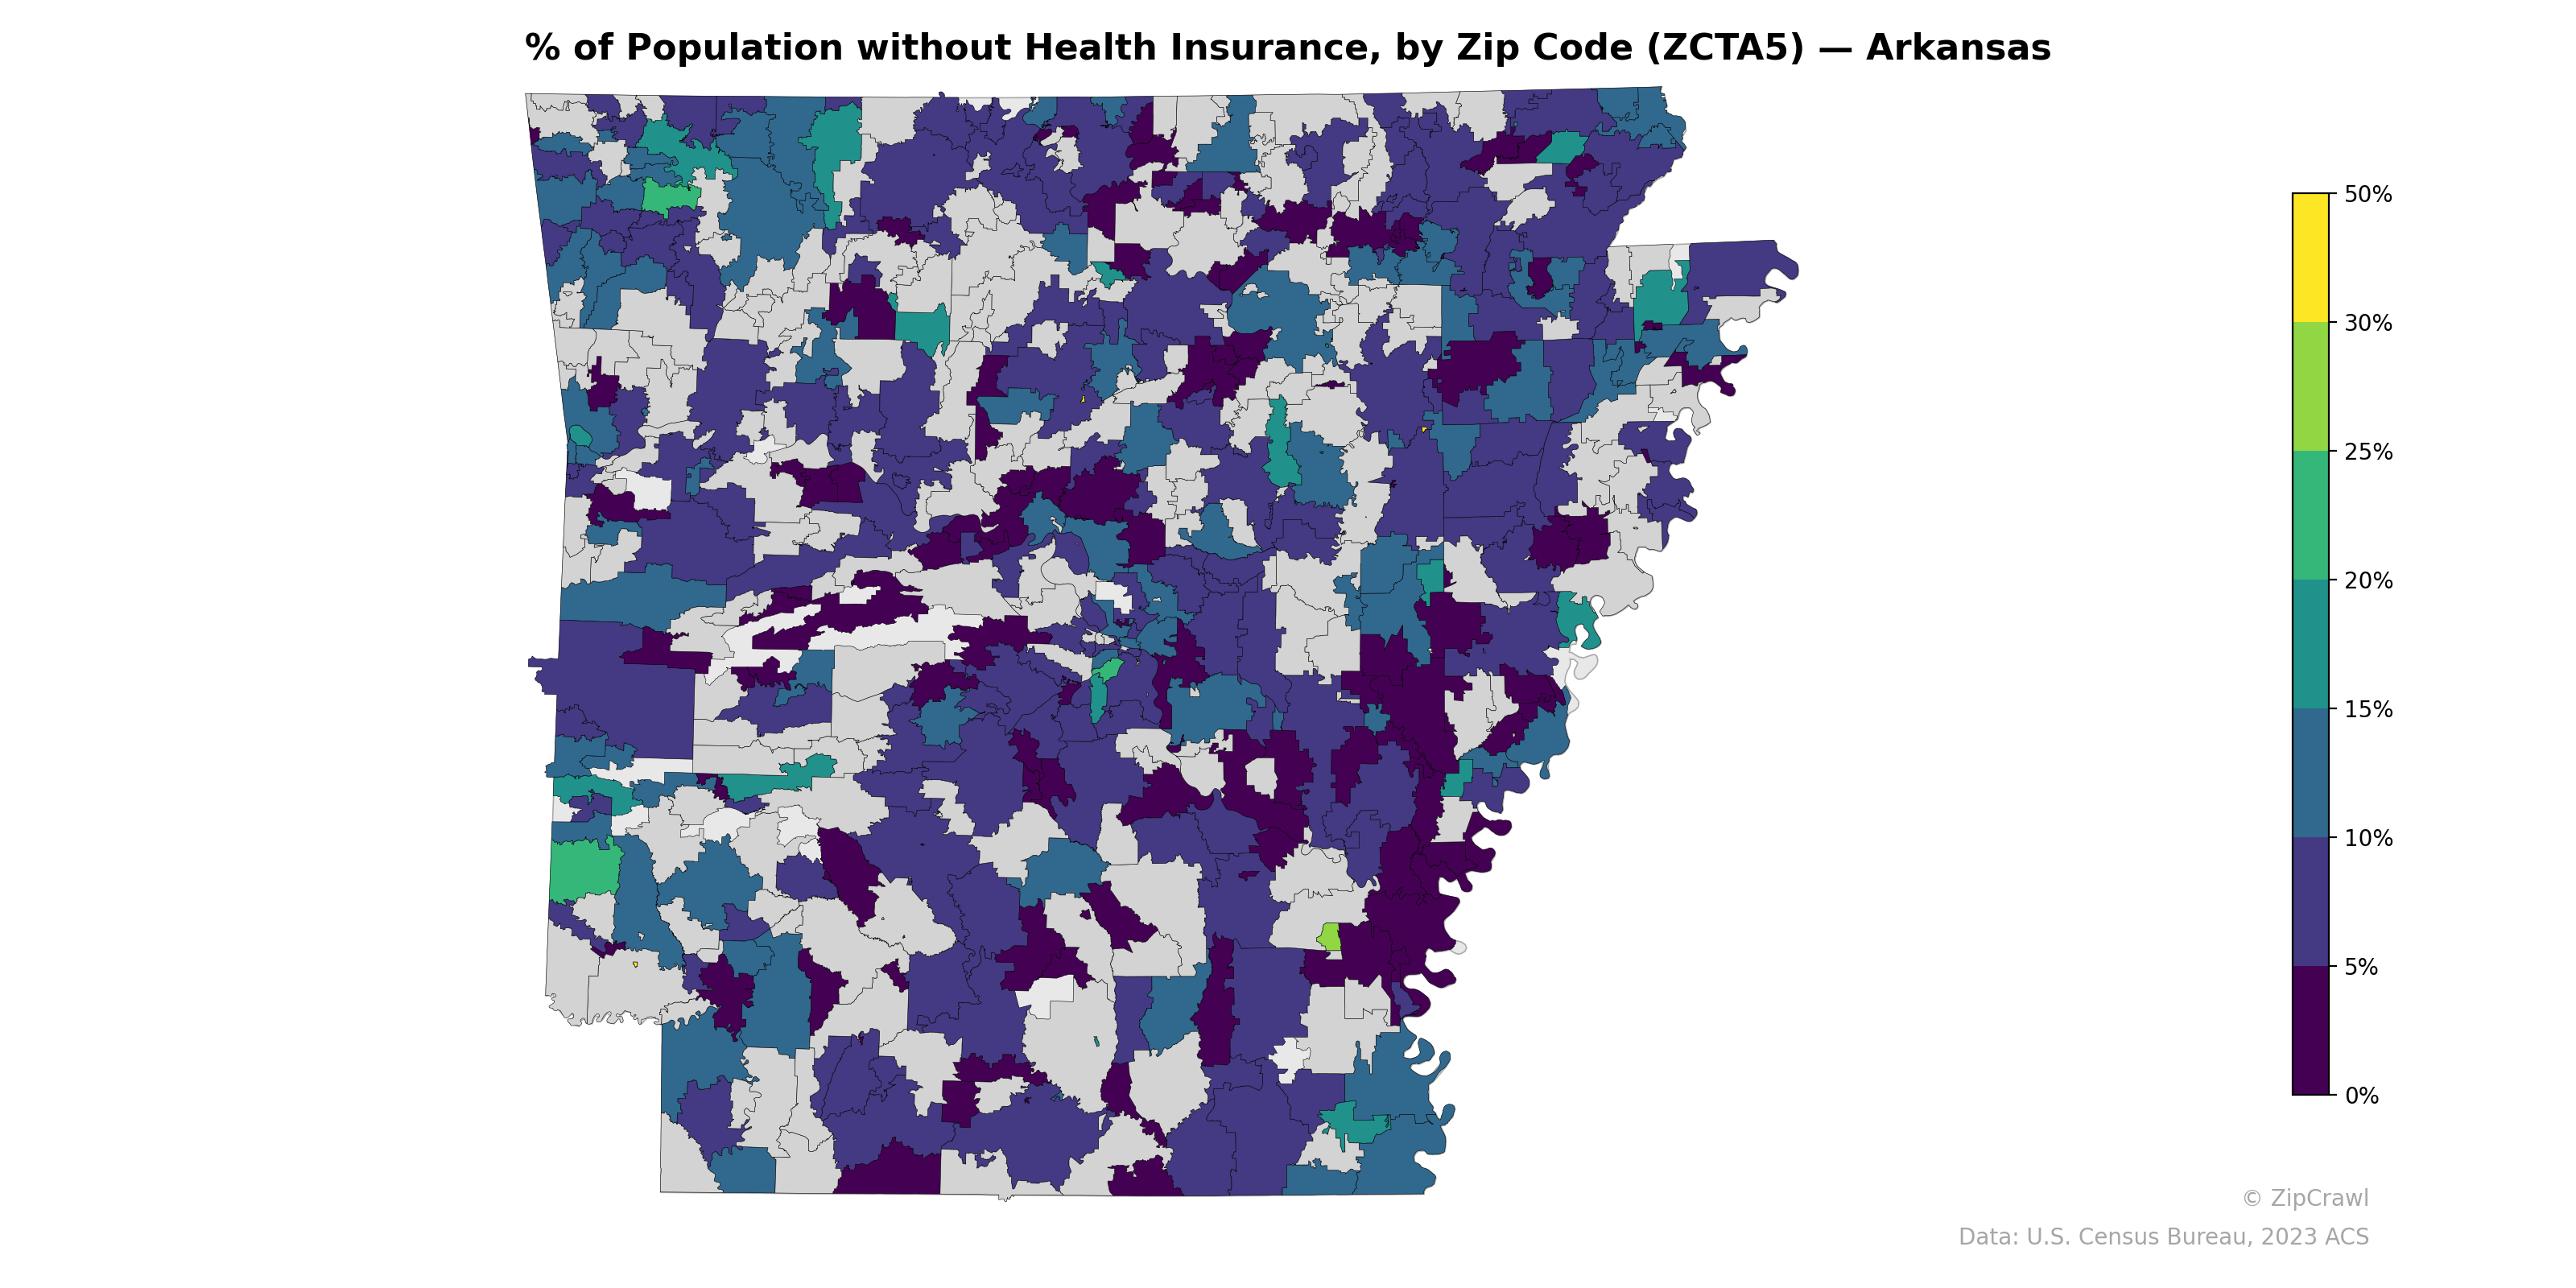
NOTE: Gray indicates insufficient data or a suppressed estimate.
Uninsured rates across Arkansas zip codes exhibit considerable spatial heterogeneity, with the highest concentrations (approaching 30–50%) appearing in scattered rural zip codes in the southwest and along portions of the southern border, while the lowest rates cluster in the northwest corner near the Fayetteville-Bentonville metro area and around the central Little Rock corridor. The eastern Delta region displays a patchwork pattern of moderate-to-high uninsured rates interspersed with low-rate zip codes, likely reflecting the influence of small-town economic conditions and variable access to employer-sponsored coverage. Notable outliers with very low uninsured rates (under 5%) appear concentrated near university towns and military installations, contrasting sharply with adjacent rural zip codes.
Data: U.S. Census Bureau, 2023 ACS
Explore
- Population Non-Hispanic American Indian % by Zip Code (ZCTA5) — Florida
- Household Average Size by Zip Code (ZCTA5) — Arkansas
- Housing Median Monthly Rent ($), by Zip Code (ZCTA5) — Arkansas
- Bachelor's Degree or Higher (% of Over 25) by Zip Code (ZCTA5) — Arkansas
- Population Non-Hispanic American Indian % by Zip Code (ZCTA5) — Arkansas
- % of Households with Broadband Internet, by Zip Code (ZCTA5) — Arkansas
- Housing % of Units Built Since 2010, by Zip Code (ZCTA5) — Arkansas
- Housing Owner-Occupied Median Value ($), by Zip Code (ZCTA5) — Arkansas
- Housing Owner-Occupied % of Units, by Zip Code (ZCTA5) — Arkansas
- High School Graduate (% of Over 25) by Zip Code (ZCTA5) — Arkansas
- Housing Owner-Occupied Median Value ($), by County
- High School Graduate (% of Over 25) by Zip Code (ZCTA5) — Florida
- Median Age by Zip Code (ZCTA5) — Miami Metro
- Population Hispanic % by Zip Code (ZCTA5) — Florida
- Population Non-Hispanic Black % by Zip Code (ZCTA5) — Florida
- Household Median Income by Zip Code (ZCTA5) — Florida
- Median Age by Zip Code (ZCTA5) — Florida
- Median Age by Zip Code (ZCTA5) — Pennsylvania
- Population Non-Hispanic Asian % by Zip Code (ZCTA5) — California
- % of Population on Food Stamps or SNAP (Last 12 Months), by Zip Code (ZCTA5) — California
- Population Non-Hispanic White % by Zip Code (ZCTA5) — Florida
- U.S. Citizens (% of Population Over 18) by Zip Code (ZCTA5) — Florida
- Household Average Size by Zip Code (ZCTA5) — Connecticut
- Median Age by Zip Code (ZCTA5) — Iowa
- Married Couple (% of all Households) by Zip Code (ZCTA5) — Connecticut
- Population Non-Hispanic American Indian % by Zip Code (ZCTA5) — Connecticut
- Household Median Income by Zip Code (ZCTA5) — Iowa
- Housing Median Monthly Rent ($), by Zip Code (ZCTA5) — Nevada
- Population Hispanic % by Zip Code (ZCTA5) — Mississippi
- Housing Vacancy Rate by Zip Code (ZCTA5) — Connecticut
- % of Population without Health Insurance, by Zip Code (ZCTA5) — Kansas
- % of Population without Health Insurance, by Zip Code (ZCTA5) — Arizona
- % of Population without Health Insurance, by Zip Code (ZCTA5) — Texas
- % of Population without Health Insurance, by Zip Code (ZCTA5) — Ohio
- % of Population without Health Insurance, by Zip Code (ZCTA5) — Iowa
- % of Population without Health Insurance, by Zip Code (ZCTA5) — Alaska
- % of Population without Health Insurance, by Zip Code (ZCTA5) — Idaho
- % of Population without Health Insurance, by Zip Code (ZCTA5) — Oregon
- % of Population without Health Insurance, by Zip Code (ZCTA5) — Utah
- % of Population without Health Insurance, by Zip Code (ZCTA5) — Alabama