NOTE: Gray indicates insufficient data or a suppressed estimate.
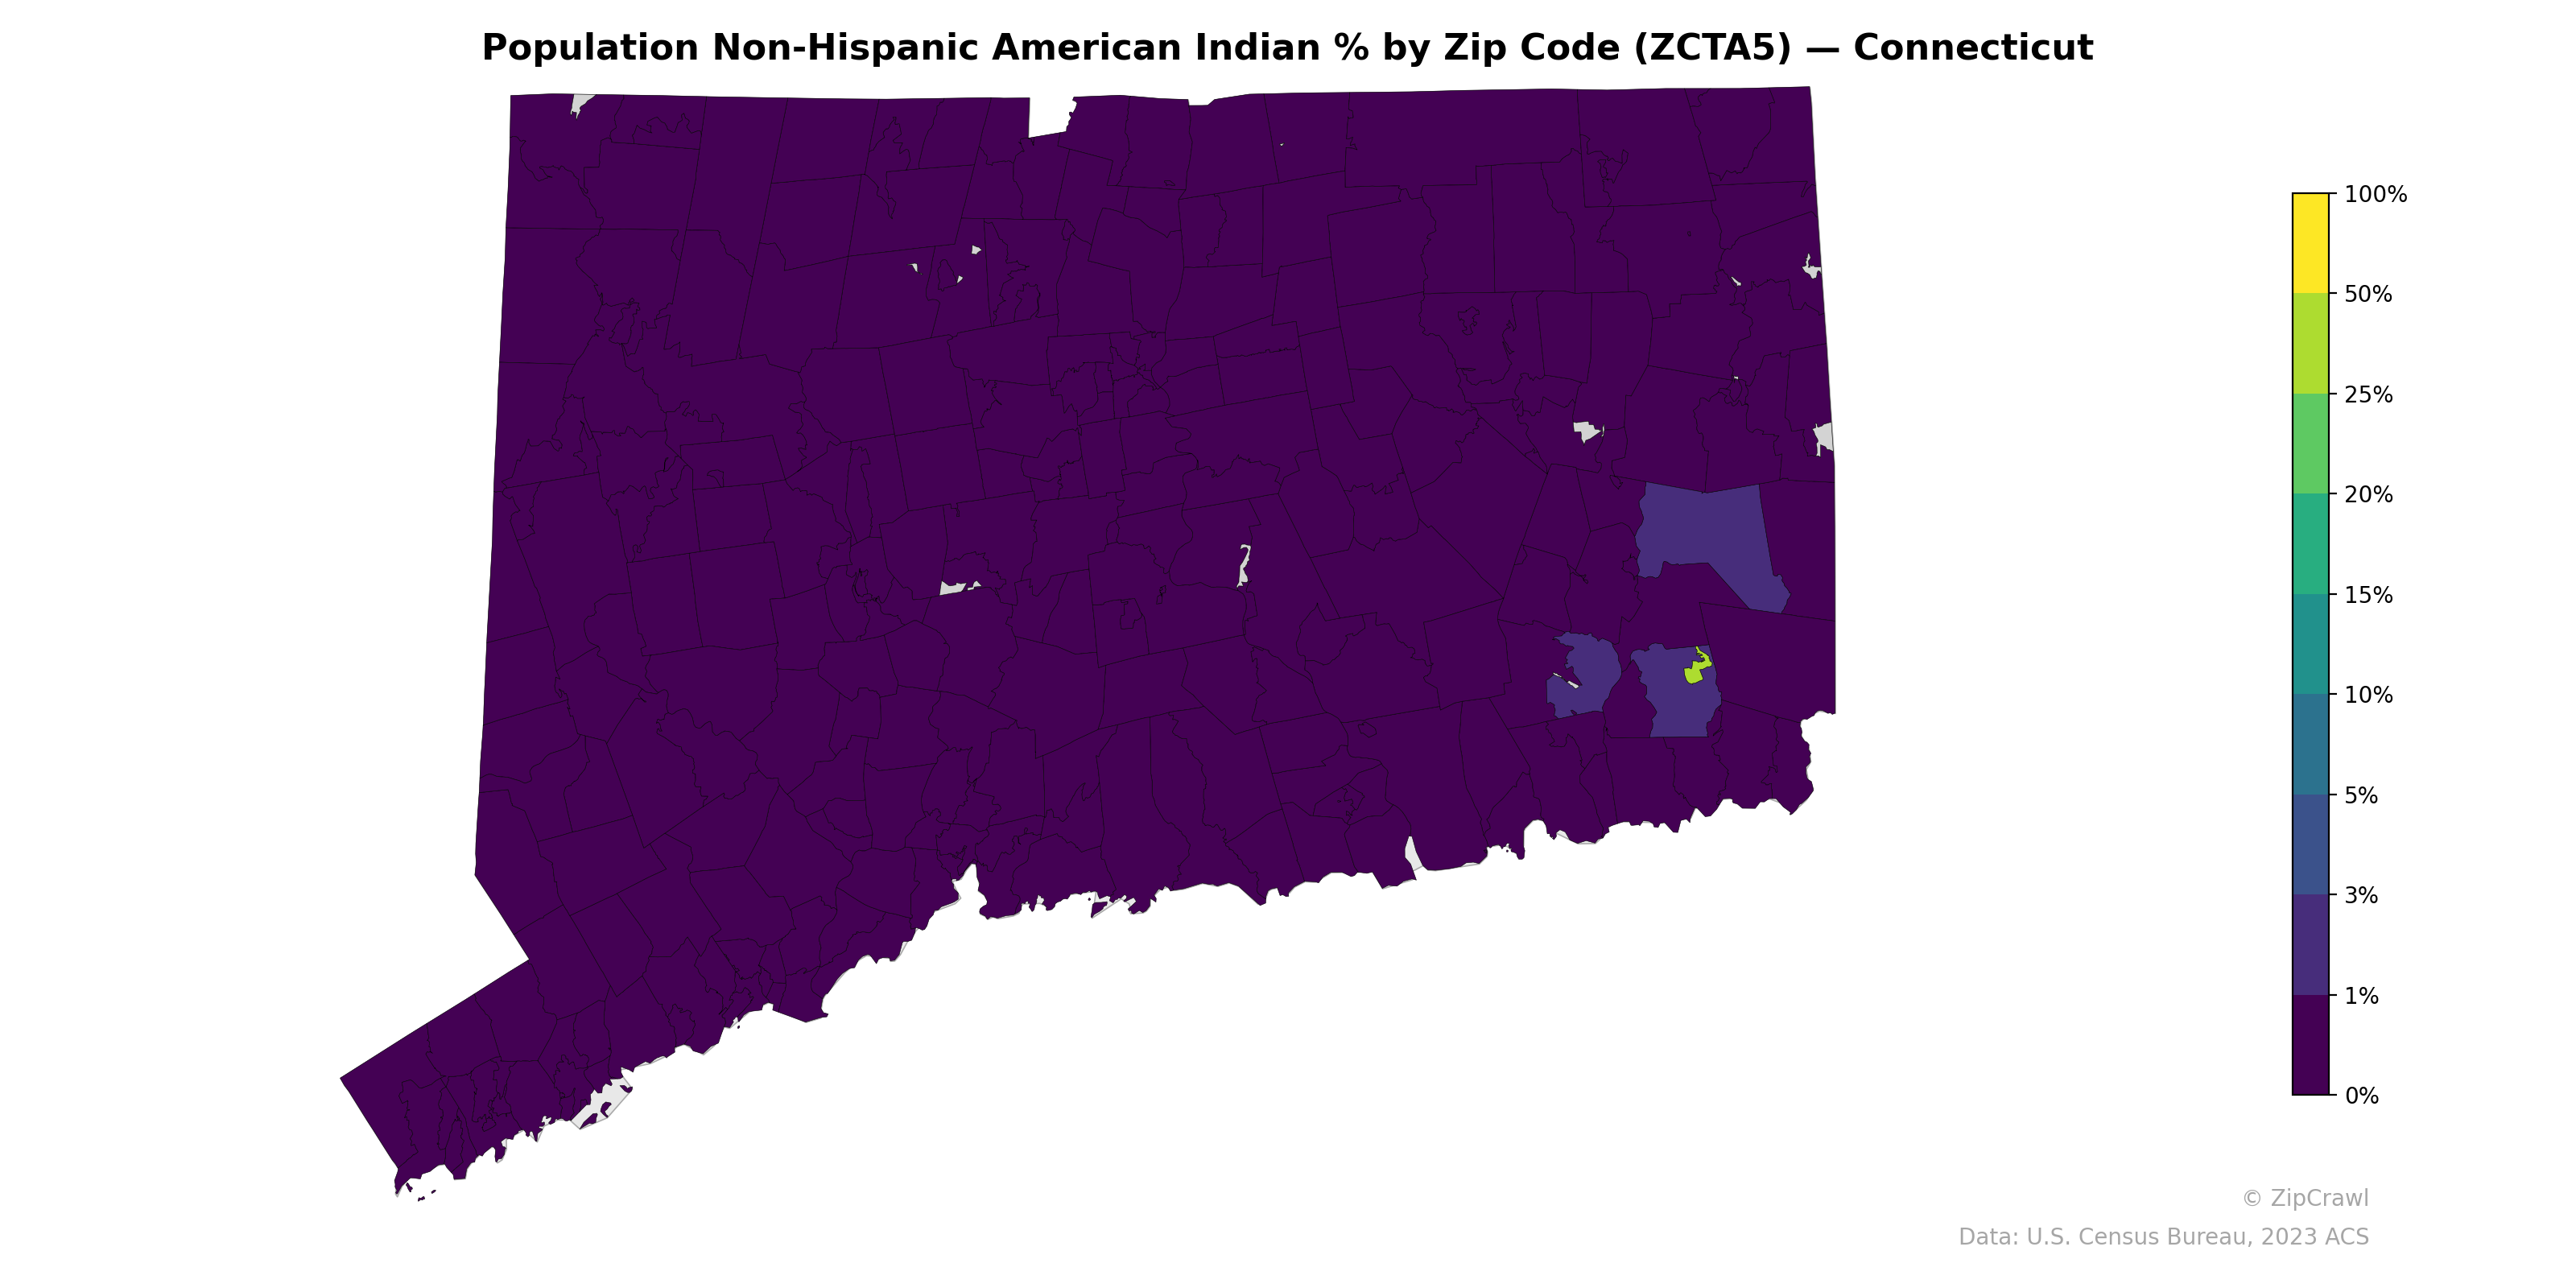
The vast majority of Connecticut zip codes register near 0% Non-Hispanic American Indian population, with the state appearing almost uniformly dark purple across its extent. A notable exception emerges in the southeastern portion of the state, likely corresponding to the Mashantucket Pequot and Mohegan tribal reservation areas near Ledyard and Montville, where one small zip code reaches approximately 20-25% and adjacent areas show elevated percentages in the 3-10% range. This highly concentrated geographic pattern reflects the presence of federally recognized tribal lands as the primary driver of spatial variation in this demographic measure.
Data: U.S. Census Bureau, 2023 ACS
Explore
- Population Non-Hispanic Asian % by Zip Code (ZCTA5) — California
- Bachelor's Degree or Higher (% of Over 25) by Zip Code (ZCTA5) — Connecticut
- High School Graduate (% of Over 25) by Zip Code (ZCTA5) — Connecticut
- Housing Median Monthly Rent ($), by Zip Code (ZCTA5) — Connecticut
- % of Households with Broadband Internet, by Zip Code (ZCTA5) — Connecticut
- Household Average Size by Zip Code (ZCTA5) — Connecticut
- Housing % of Units Built Since 2010, by Zip Code (ZCTA5) — Connecticut
- Housing Owner-Occupied % of Units, by Zip Code (ZCTA5) — Connecticut
- Housing Owner-Occupied Median Value ($), by Zip Code (ZCTA5) — Connecticut
- % of Population without Health Insurance, by Zip Code (ZCTA5) — Connecticut
- Housing Owner-Occupied Median Value ($), by County
- High School Graduate (% of Over 25) by Zip Code (ZCTA5) — Florida
- Population Hispanic % by Zip Code (ZCTA5) — Florida
- Population Non-Hispanic Black % by Zip Code (ZCTA5) — Florida
- U.S. Citizens (% of Population Over 18) by Zip Code (ZCTA5) — Florida
- Household Median Income by Zip Code (ZCTA5) — Florida
- Population Non-Hispanic Asian % by Zip Code (ZCTA5) — Pennsylvania
- Median Age by Zip Code (ZCTA5) — Florida
- % of Population on Food Stamps or SNAP (Last 12 Months), by Zip Code (ZCTA5) — California
- Population Non-Hispanic Asian % by Zip Code (ZCTA5) — Texas
- Population Non-Hispanic White % by Zip Code (ZCTA5) — Florida
- Married Couple (% of all Households) by Zip Code (ZCTA5) — Connecticut
- Median Age by Zip Code (ZCTA5) — Iowa
- Housing Vacancy Rate by Zip Code (ZCTA5) — Connecticut
- Housing Median Monthly Rent ($), by Zip Code (ZCTA5) — Nevada
- Household Median Income by Zip Code (ZCTA5) — Iowa
- Population Non-Hispanic Asian % by Zip Code (ZCTA5) — Connecticut
- Population Hispanic % by Zip Code (ZCTA5) — Mississippi
- % of Population on Food Stamps or SNAP (Last 12 Months), by Zip Code (ZCTA5) — Connecticut
- U.S. Citizens (% of Population Over 18) by Zip Code (ZCTA5) — Utah
- Population Non-Hispanic American Indian % by Zip Code (ZCTA5) — Indiana
- Population Non-Hispanic American Indian % by Zip Code (ZCTA5) — Iowa
- Population Non-Hispanic American Indian % by Zip Code (ZCTA5) — Utah
- Population Non-Hispanic American Indian % by Zip Code (ZCTA5) — Ohio
- Population Non-Hispanic American Indian % by Zip Code (ZCTA5) — Idaho
- Population Non-Hispanic American Indian % by Zip Code (ZCTA5) — Hawaii
- Population Non-Hispanic American Indian % by Zip Code (ZCTA5) — Nevada
- Population Non-Hispanic American Indian % by Zip Code (ZCTA5) — Texas
- Population Non-Hispanic American Indian % by Zip Code (ZCTA5) — Oregon
- Population Non-Hispanic American Indian % by Zip Code (ZCTA5) — Maine