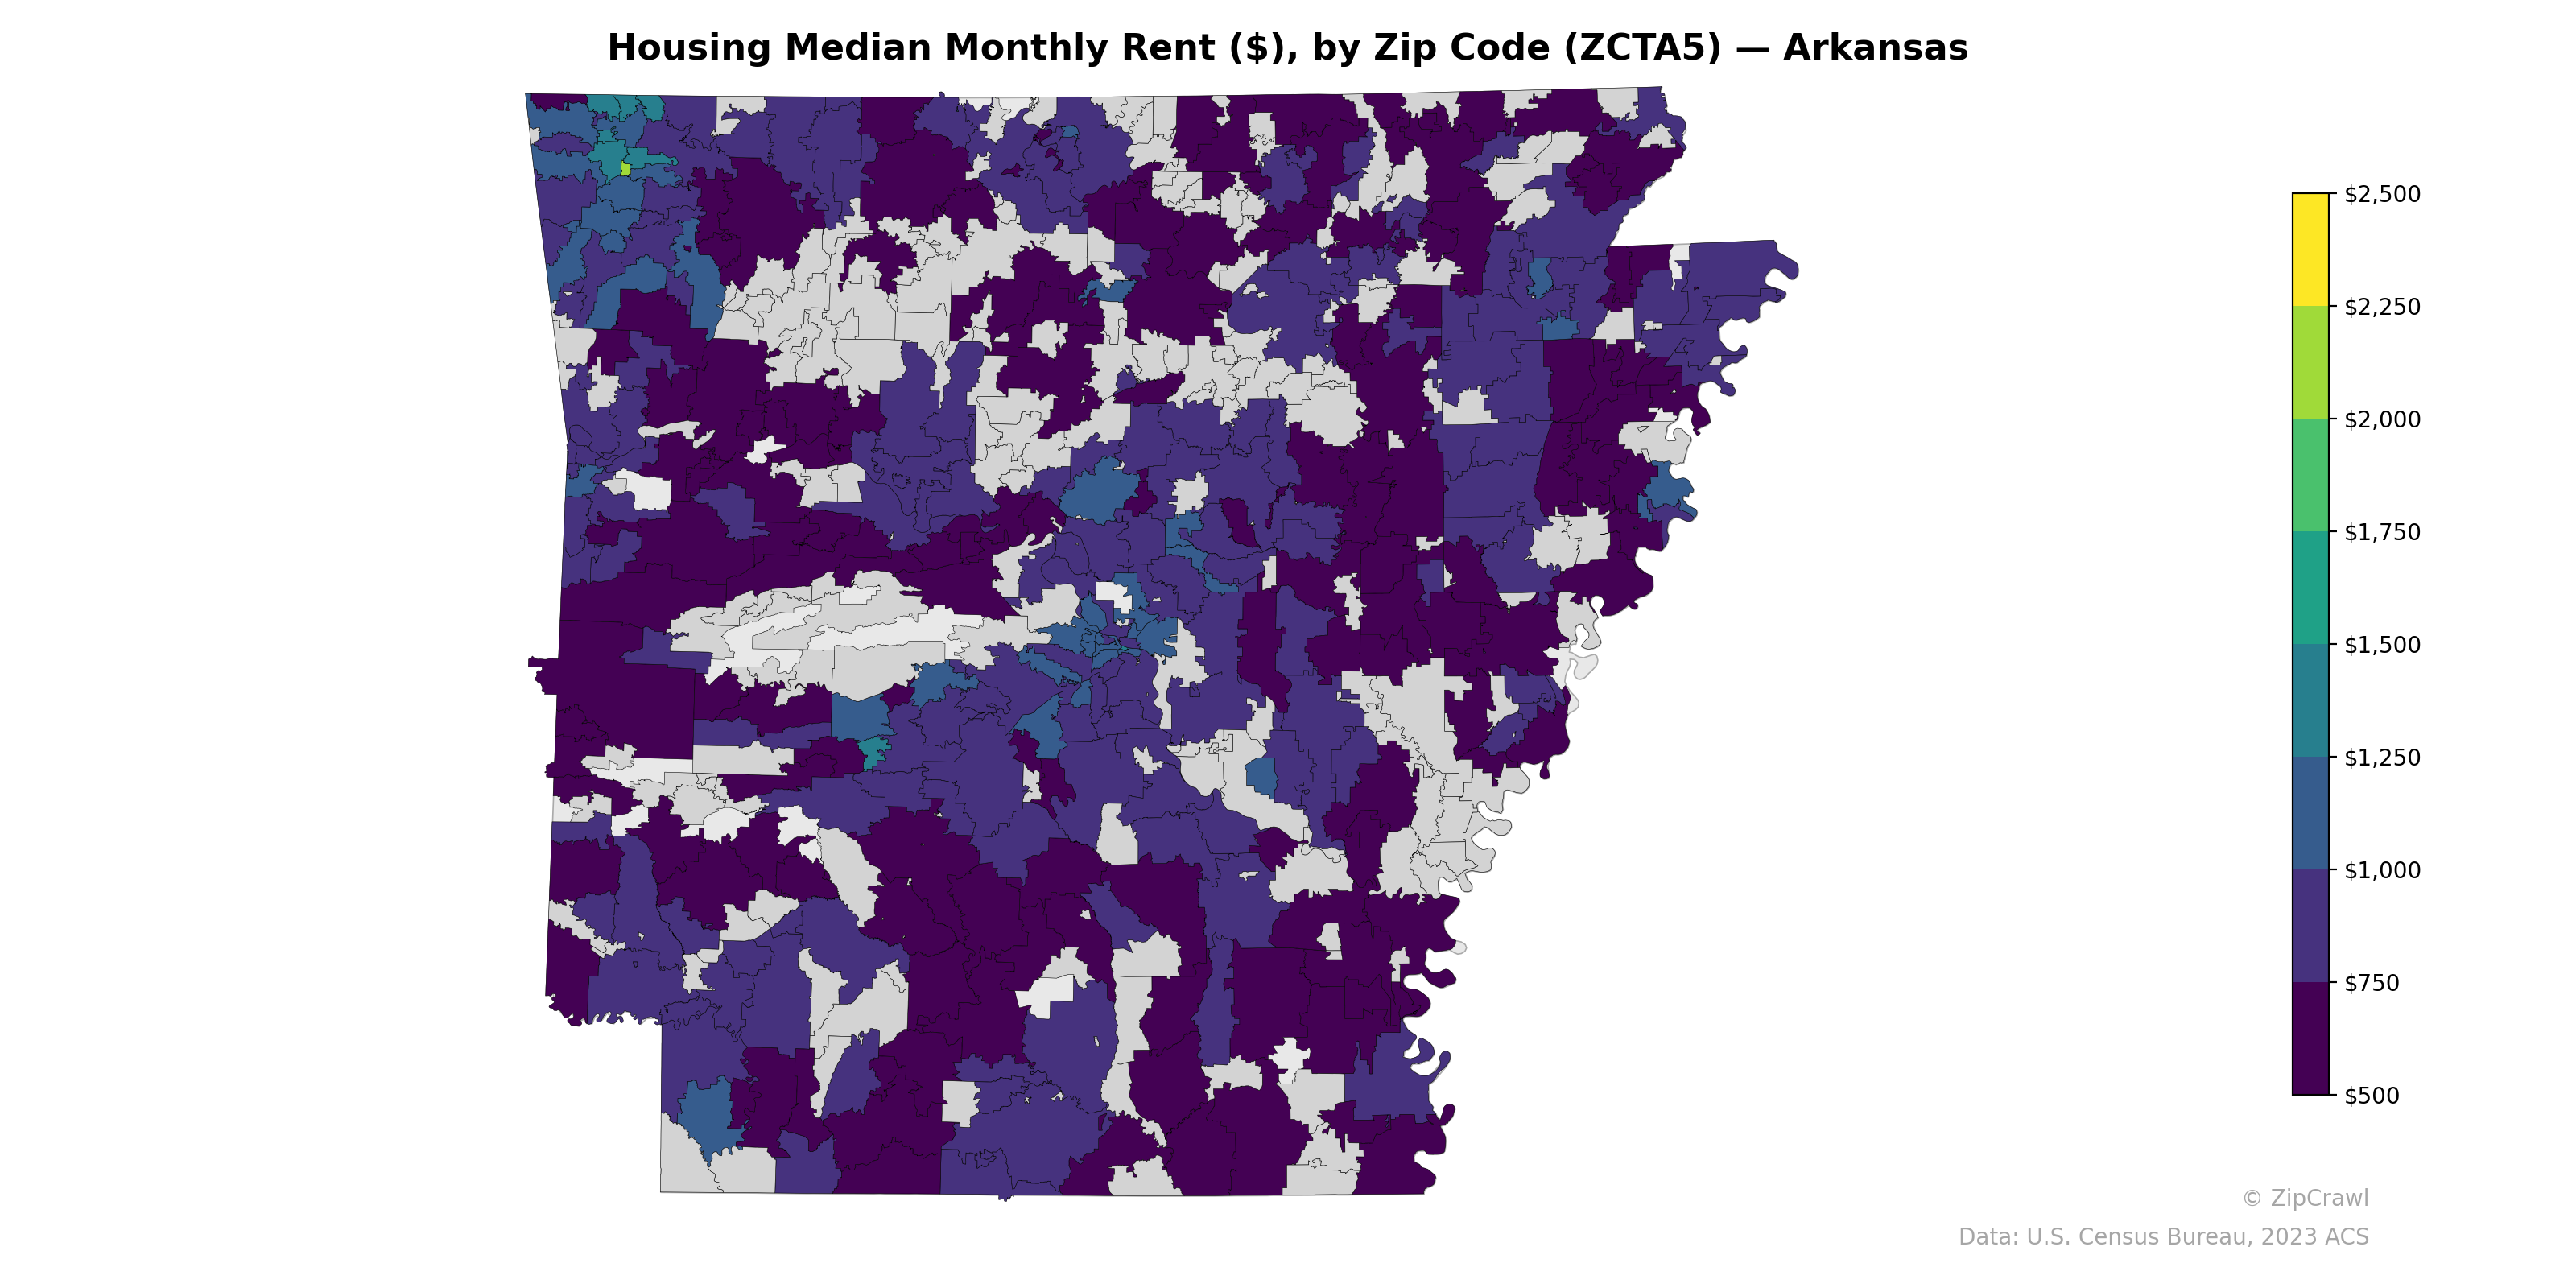
NOTE: Gray indicates insufficient data or a suppressed estimate.
Northwest Arkansas zip codes—particularly in the Bentonville-Rogers-Fayetteville corridor—exhibit the highest median monthly rents in the state, with several areas exceeding $1,250 and at least one zip code reaching near $2,500, reflecting the economic influence of major employers like Walmart and the University of Arkansas. The central part of the state around Little Rock also displays moderately elevated rents compared to surrounding areas, though not reaching the peaks seen in the northwest. Much of southern and rural Arkansas remains firmly in the $500–$750 range, with extensive clusters of the lowest rent levels in the Delta region to the east and the Ouachita Mountains to the southwest, underscoring the persistent urban-rural economic divide across the state.
Data: U.S. Census Bureau, 2023 ACS
Explore
- Population Non-Hispanic American Indian % by Zip Code (ZCTA5) — Florida
- Housing % of Units Built Since 2010, by Zip Code (ZCTA5) — Arkansas
- Housing Owner-Occupied % of Units, by Zip Code (ZCTA5) — Arkansas
- % of Households with Broadband Internet, by Zip Code (ZCTA5) — Arkansas
- Household Average Size by Zip Code (ZCTA5) — Arkansas
- Population Non-Hispanic American Indian % by Zip Code (ZCTA5) — Arkansas
- Housing Owner-Occupied Median Value ($), by Zip Code (ZCTA5) — Arkansas
- % of Population without Health Insurance, by Zip Code (ZCTA5) — Arkansas
- High School Graduate (% of Over 25) by Zip Code (ZCTA5) — Arkansas
- Bachelor's Degree or Higher (% of Over 25) by Zip Code (ZCTA5) — Arkansas
- Housing Owner-Occupied Median Value ($), by County
- High School Graduate (% of Over 25) by Zip Code (ZCTA5) — Florida
- Population Non-Hispanic Black % by Zip Code (ZCTA5) — Miami Metro
- Population Non-Hispanic Black % by Zip Code (ZCTA5) — Florida
- Median Age by Zip Code (ZCTA5) — Florida
- U.S. Citizens (% of Population Over 18) by Zip Code (ZCTA5) — Florida
- Population Non-Hispanic White % by Zip Code (ZCTA5) — Florida
- Population Non-Hispanic Asian % by Zip Code (ZCTA5) — California
- % of Population on Food Stamps or SNAP (Last 12 Months), by Zip Code (ZCTA5) — California
- Population Non-Hispanic Black % by Zip Code (ZCTA5) — Pennsylvania
- Population Hispanic % by Zip Code (ZCTA5) — Florida
- Household Median Income by Zip Code (ZCTA5) — Florida
- Married Couple (% of all Households) by Zip Code (ZCTA5) — Connecticut
- High School Graduate (% of Over 25) by Zip Code (ZCTA5) — Connecticut
- Housing Vacancy Rate by Zip Code (ZCTA5) — Connecticut
- Household Median Income by Zip Code (ZCTA5) — Iowa
- Median Age by Zip Code (ZCTA5) — Iowa
- Population Hispanic % by Zip Code (ZCTA5) — Mississippi
- Population Non-Hispanic American Indian % by Zip Code (ZCTA5) — Connecticut
- Bachelor's Degree or Higher (% of Over 25) by Zip Code (ZCTA5) — Connecticut
- Housing Median Monthly Rent ($), by Zip Code (ZCTA5) — Kansas
- Housing Median Monthly Rent ($), by Zip Code (ZCTA5) — Arizona
- Housing Median Monthly Rent ($), by Zip Code (ZCTA5) — Texas
- Housing Median Monthly Rent ($), by Zip Code (ZCTA5) — Montana
- Housing Median Monthly Rent ($), by Zip Code (ZCTA5) — Alaska
- Housing Median Monthly Rent ($), by Zip Code (ZCTA5) — Ohio
- Housing Median Monthly Rent ($), by Zip Code (ZCTA5) — Iowa
- Housing Median Monthly Rent ($), by Zip Code (ZCTA5) — Utah
- Housing Median Monthly Rent ($), by Zip Code (ZCTA5) — Maine
- Housing Median Monthly Rent ($), by Zip Code (ZCTA5) — Vermont