NOTE: Gray indicates insufficient data or a suppressed estimate.
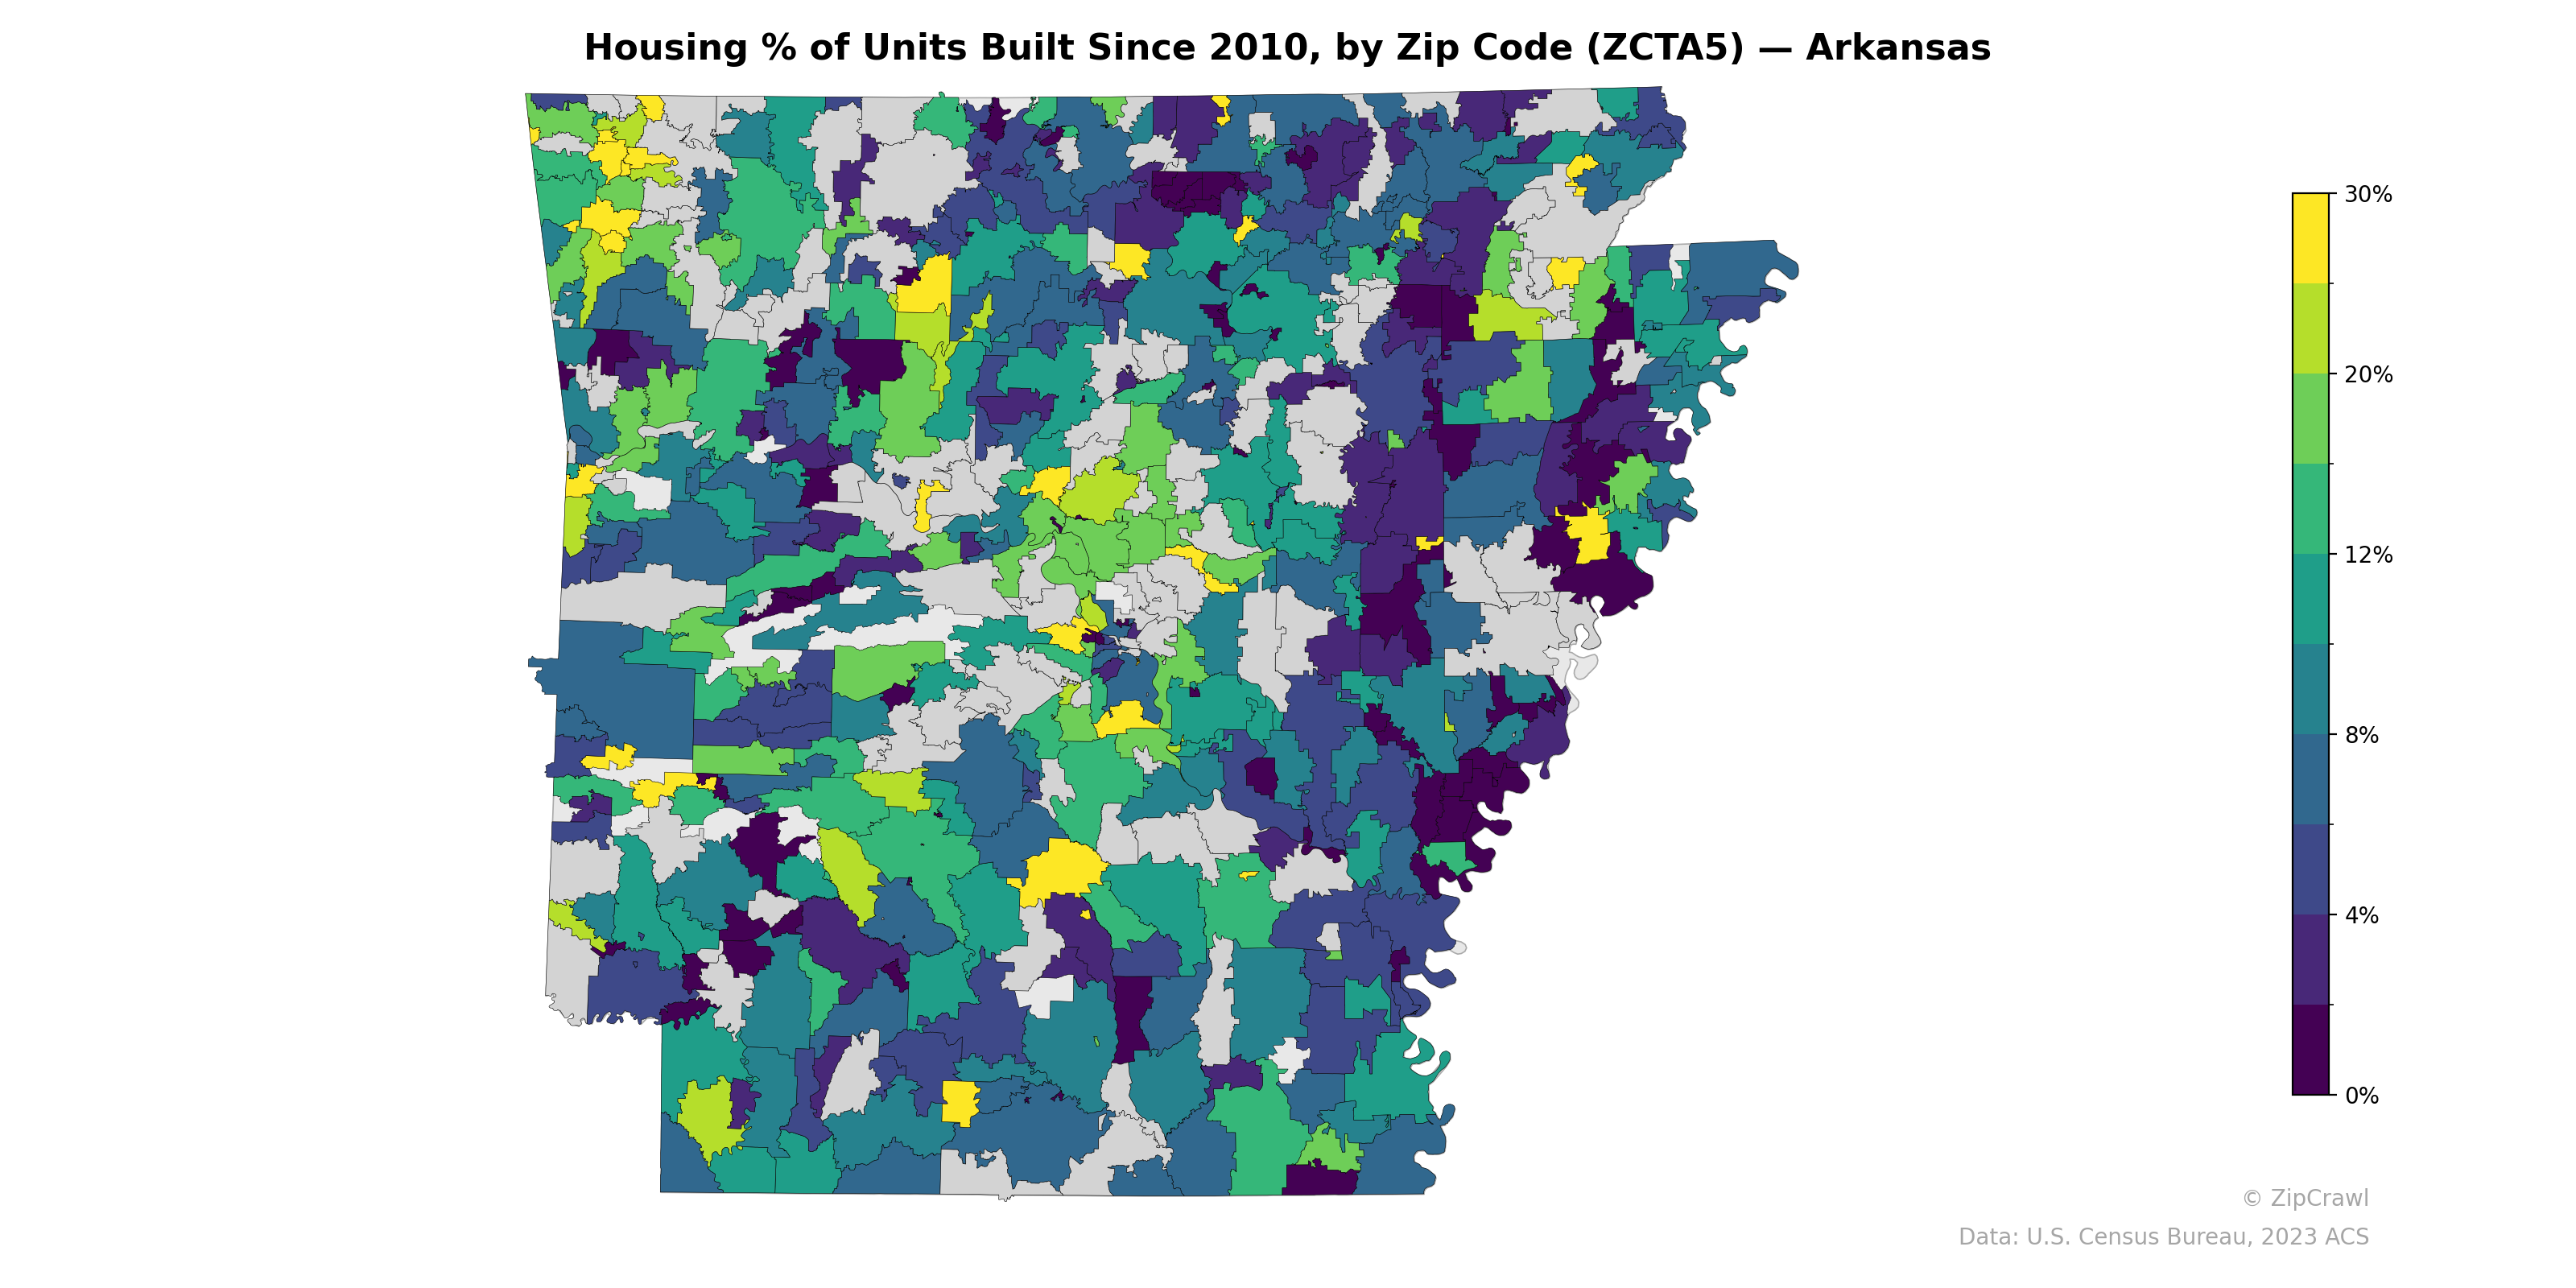
Northwest Arkansas zip codes—particularly in the Benton and Washington County corridor—display consistently elevated shares of housing built since 2010, with several zones exceeding 20–30%, reflecting the region's sustained population and economic growth driven by major corporate headquarters. Central Arkansas around the Little Rock metro shows a more mixed pattern, with pockets of newer construction interspersed among older housing stock, while the eastern Delta region and parts of southern Arkansas are dominated by dark blue and purple tones indicating minimal new construction, often below 4%. The starkest contrast runs diagonally from the booming northwest to the economically stagnant southeast, underscoring a persistent geographic divide in development activity across the state.
Data: U.S. Census Bureau, 2023 ACS
Explore
- Population Non-Hispanic American Indian % by Zip Code (ZCTA5) — Florida
- Housing Median Monthly Rent ($), by Zip Code (ZCTA5) — Arkansas
- Housing Owner-Occupied % of Units, by Zip Code (ZCTA5) — Arkansas
- % of Households with Broadband Internet, by Zip Code (ZCTA5) — Arkansas
- Household Average Size by Zip Code (ZCTA5) — Arkansas
- Population Non-Hispanic American Indian % by Zip Code (ZCTA5) — Arkansas
- Housing Owner-Occupied Median Value ($), by Zip Code (ZCTA5) — Arkansas
- % of Population without Health Insurance, by Zip Code (ZCTA5) — Arkansas
- High School Graduate (% of Over 25) by Zip Code (ZCTA5) — Arkansas
- Bachelor's Degree or Higher (% of Over 25) by Zip Code (ZCTA5) — Arkansas
- Housing Owner-Occupied Median Value ($), by County
- High School Graduate (% of Over 25) by Zip Code (ZCTA5) — Florida
- Population Non-Hispanic American Indian % by Zip Code (ZCTA5) — Miami Metro
- Population Non-Hispanic Black % by Zip Code (ZCTA5) — Florida
- Median Age by Zip Code (ZCTA5) — Florida
- U.S. Citizens (% of Population Over 18) by Zip Code (ZCTA5) — Florida
- Population Non-Hispanic White % by Zip Code (ZCTA5) — Florida
- Population Non-Hispanic Asian % by Zip Code (ZCTA5) — California
- % of Population on Food Stamps or SNAP (Last 12 Months), by Zip Code (ZCTA5) — California
- Population Non-Hispanic American Indian % by Zip Code (ZCTA5) — Pennsylvania
- Population Hispanic % by Zip Code (ZCTA5) — Florida
- Household Median Income by Zip Code (ZCTA5) — Florida
- Household Average Size by Zip Code (ZCTA5) — Connecticut
- Population Non-Hispanic American Indian % by Zip Code (ZCTA5) — Connecticut
- Married Couple (% of all Households) by Zip Code (ZCTA5) — Connecticut
- Housing Median Monthly Rent ($), by Zip Code (ZCTA5) — Nevada
- Population Hispanic % by Zip Code (ZCTA5) — Mississippi
- Household Median Income by Zip Code (ZCTA5) — Iowa
- Median Age by Zip Code (ZCTA5) — Iowa
- High School Graduate (% of Over 25) by Zip Code (ZCTA5) — Connecticut
- Housing % of Units Built Since 2010, by Zip Code (ZCTA5) — Kansas
- Housing % of Units Built Since 2010, by Zip Code (ZCTA5) — Arizona
- Housing % of Units Built Since 2010, by Zip Code (ZCTA5) — Texas
- Housing % of Units Built Since 2010, by Zip Code (ZCTA5) — Ohio
- Housing % of Units Built Since 2010, by Zip Code (ZCTA5) — Utah
- Housing % of Units Built Since 2010, by Zip Code (ZCTA5) — Alaska
- Housing % of Units Built Since 2010, by Zip Code (ZCTA5) — Iowa
- Housing % of Units Built Since 2010, by Zip Code (ZCTA5) — Alabama
- Housing % of Units Built Since 2010, by Zip Code (ZCTA5) — Idaho
- Housing % of Units Built Since 2010, by Zip Code (ZCTA5) — Oregon