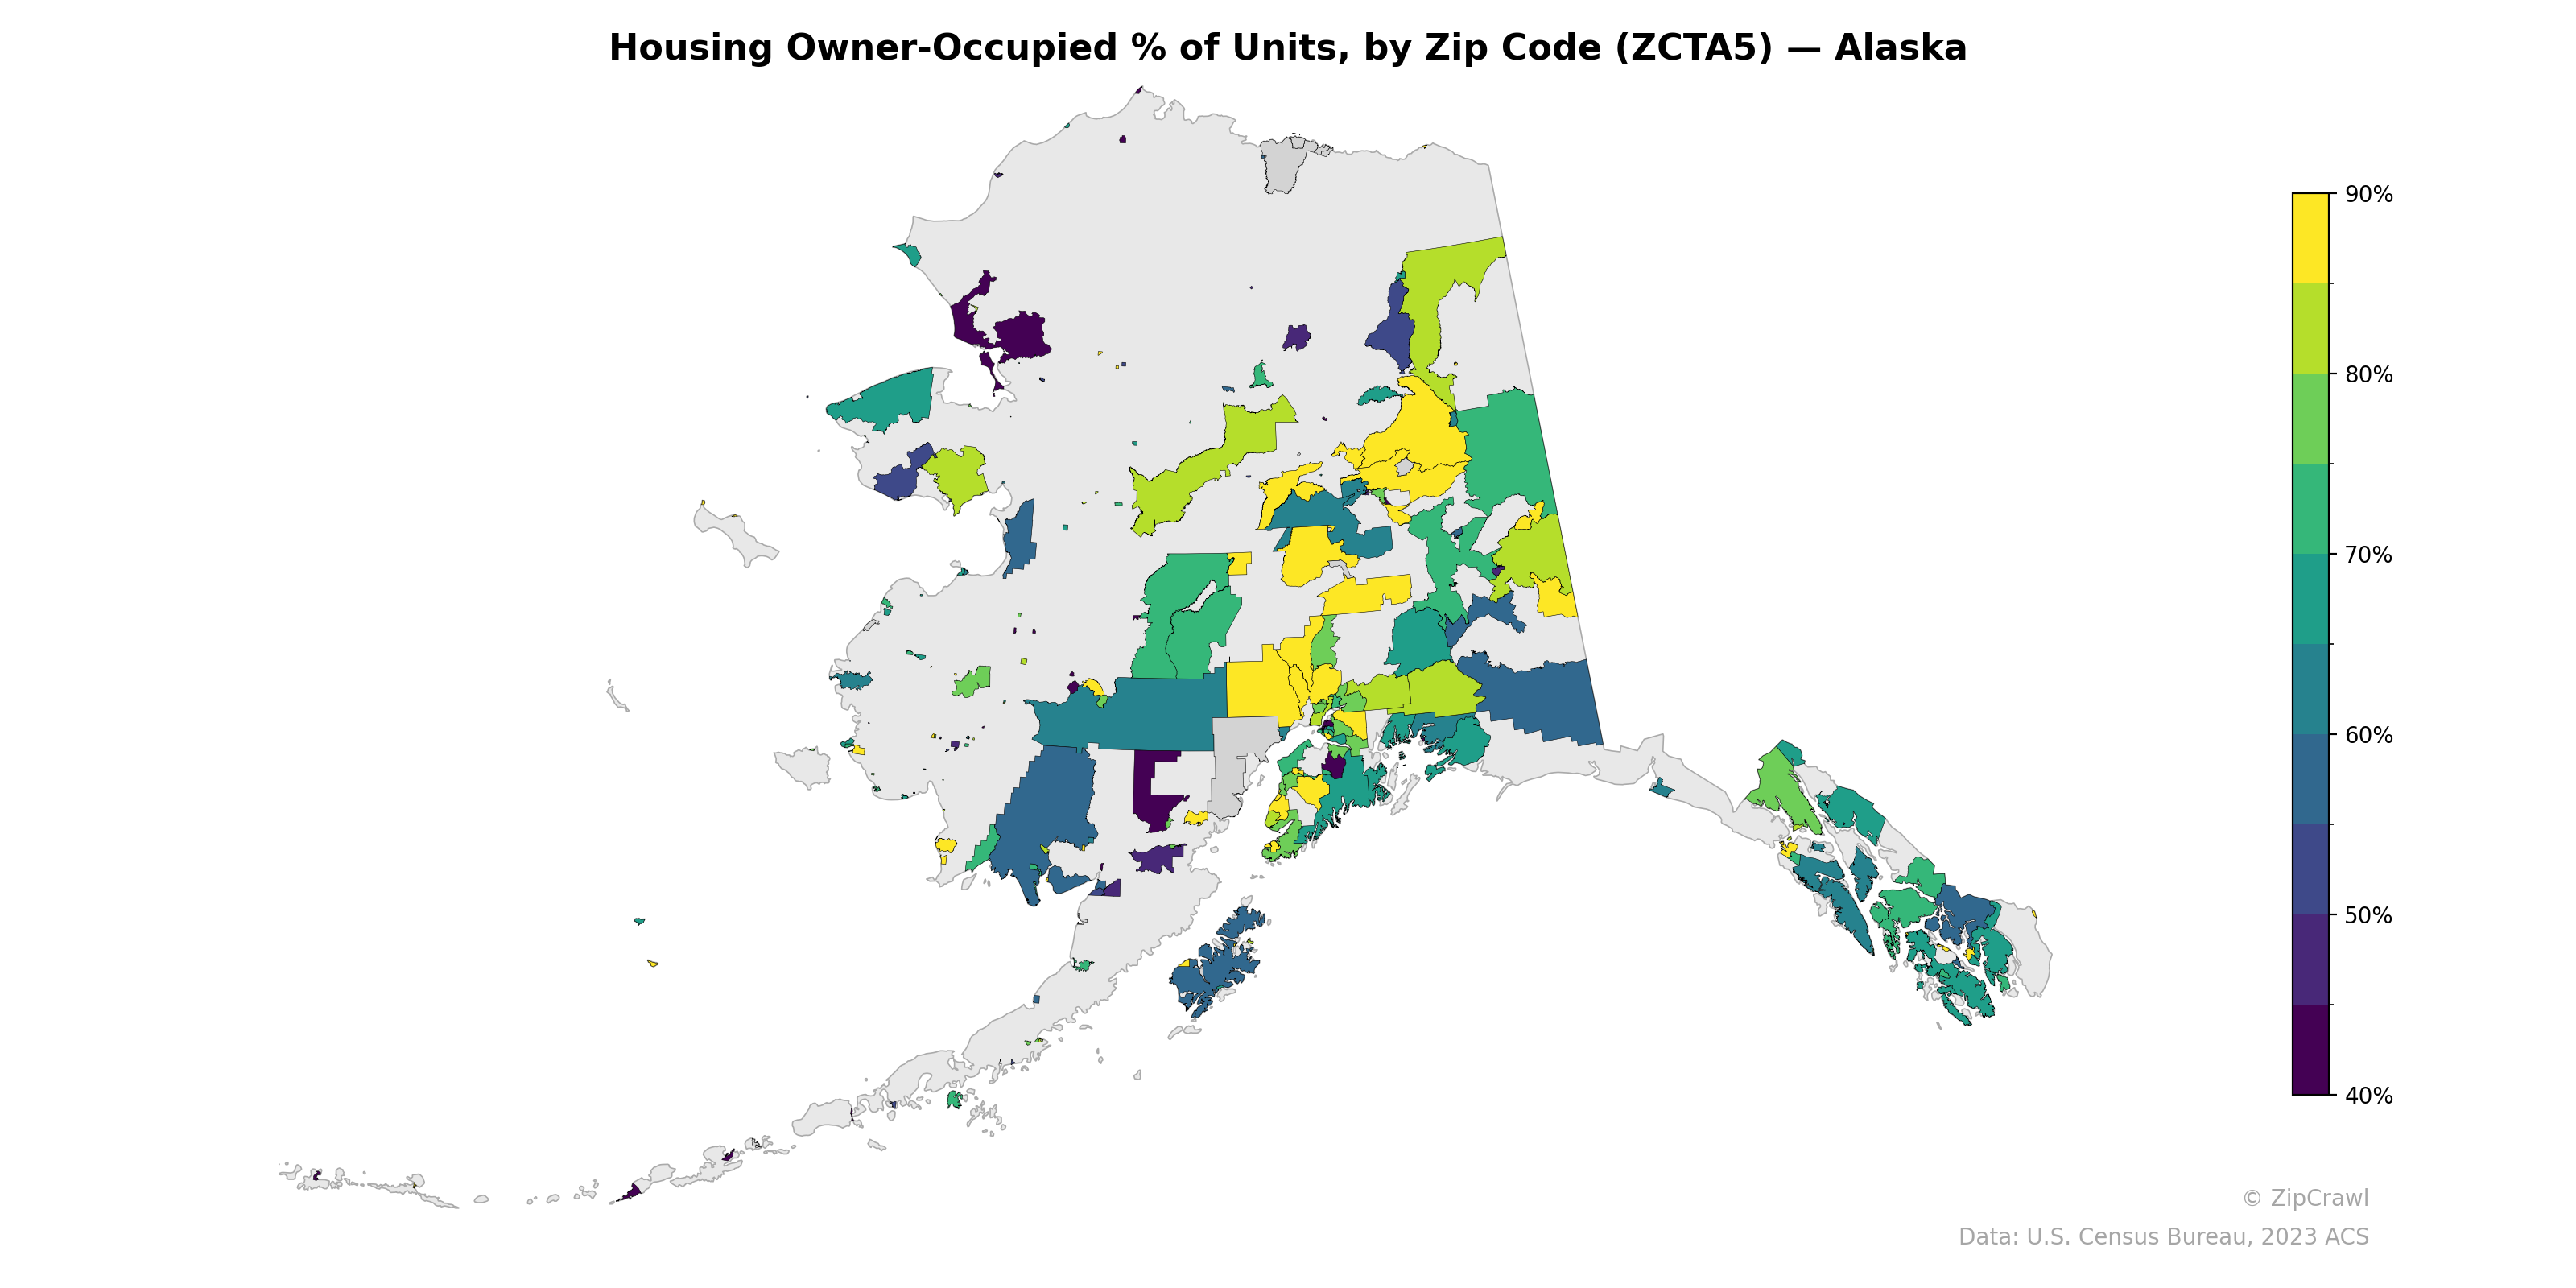
NOTE: Gray indicates insufficient data or a suppressed estimate.
Interior and Fairbanks-area zip codes display notably high owner-occupancy rates (80–90%), forming a distinct yellow cluster in central Alaska, while zip codes in the Anchorage metropolitan area and parts of Southeast Alaska trend considerably lower, falling into the 40–55% range. The Aleutian chain and western coastal communities generally exhibit lower owner-occupancy percentages, likely reflecting the prevalence of rental housing in remote and military-adjacent areas. A sharp contrast is visible between the Matanuska-Susitna Valley's elevated homeownership rates and neighboring Anchorage, underscoring suburban-urban tenure differences even within the same regional economy.
Data: U.S. Census Bureau, 2023 ACS
Explore
- Married Couple (% of all Households) by Zip Code (ZCTA5) — New York
- Household Average Size by Zip Code (ZCTA5) — Alaska
- Housing Owner-Occupied Median Value ($), by Zip Code (ZCTA5) — Alaska
- Population Non-Hispanic American Indian % by Zip Code (ZCTA5) — Alaska
- Housing % of Units Built Since 2010, by Zip Code (ZCTA5) — Alaska
- Housing Median Monthly Rent ($), by Zip Code (ZCTA5) — Alaska
- % of Households with Broadband Internet, by Zip Code (ZCTA5) — Alaska
- % of Population without Health Insurance, by Zip Code (ZCTA5) — Alaska
- High School Graduate (% of Over 25) by Zip Code (ZCTA5) — Alaska
- Bachelor's Degree or Higher (% of Over 25) by Zip Code (ZCTA5) — Alaska
- Household Average Size by County
- Population Non-Hispanic White % by Zip Code (ZCTA5) — Maryland
- Housing Owner-Occupied Median Value ($), by Zip Code (ZCTA5) — New York
- Housing Median Monthly Rent ($), by Zip Code (ZCTA5) — New York
- % of Population without Health Insurance, by Zip Code (ZCTA5) — New York
- Housing % of Units Built Since 2010, by Zip Code (ZCTA5) — New York
- Population Non-Hispanic White % by Zip Code (ZCTA5) — Pennsylvania
- Housing Vacancy Rate by Zip Code (ZCTA5) — New York
- Bachelor's Degree or Higher (% of Over 25) by Zip Code (ZCTA5) — New York
- % of Households with Broadband Internet, by Zip Code (ZCTA5) — New York
- Household Average Size by Zip Code (ZCTA5) — New York
- Married Couple (% of all Households) by Zip Code (ZCTA5) — Rhode Island
- Population Non-Hispanic American Indian % by Zip Code (ZCTA5) — Rhode Island
- Housing Vacancy Rate by Zip Code (ZCTA5) — Rhode Island
- Population Hispanic % by Zip Code (ZCTA5) — Oregon
- Population Non-Hispanic Black % by Zip Code (ZCTA5) — North Dakota
- Bachelor's Degree or Higher (% of Over 25) by Zip Code (ZCTA5) — Rhode Island
- Population Non-Hispanic American Indian % by Zip Code (ZCTA5) — North Dakota
- High School Graduate (% of Over 25) by Zip Code (ZCTA5) — Rhode Island
- Housing Vacancy Rate by Zip Code (ZCTA5) — Alaska
- Housing Owner-Occupied % of Units, by Zip Code (ZCTA5) — Alabama
- Housing Owner-Occupied % of Units, by Zip Code (ZCTA5) — Nebraska
- Housing Owner-Occupied % of Units, by Zip Code (ZCTA5) — Ohio
- Housing Owner-Occupied % of Units, by Zip Code (ZCTA5) — Utah
- Housing Owner-Occupied % of Units, by Zip Code (ZCTA5) — Iowa
- Housing Owner-Occupied % of Units, by Zip Code (ZCTA5) — Arizona
- Housing Owner-Occupied % of Units, by Zip Code (ZCTA5) — Texas
- Housing Owner-Occupied % of Units, by Zip Code (ZCTA5) — Oregon
- Housing Owner-Occupied % of Units, by Zip Code (ZCTA5) — Idaho
- Housing Owner-Occupied % of Units, by Zip Code (ZCTA5) — Hawaii