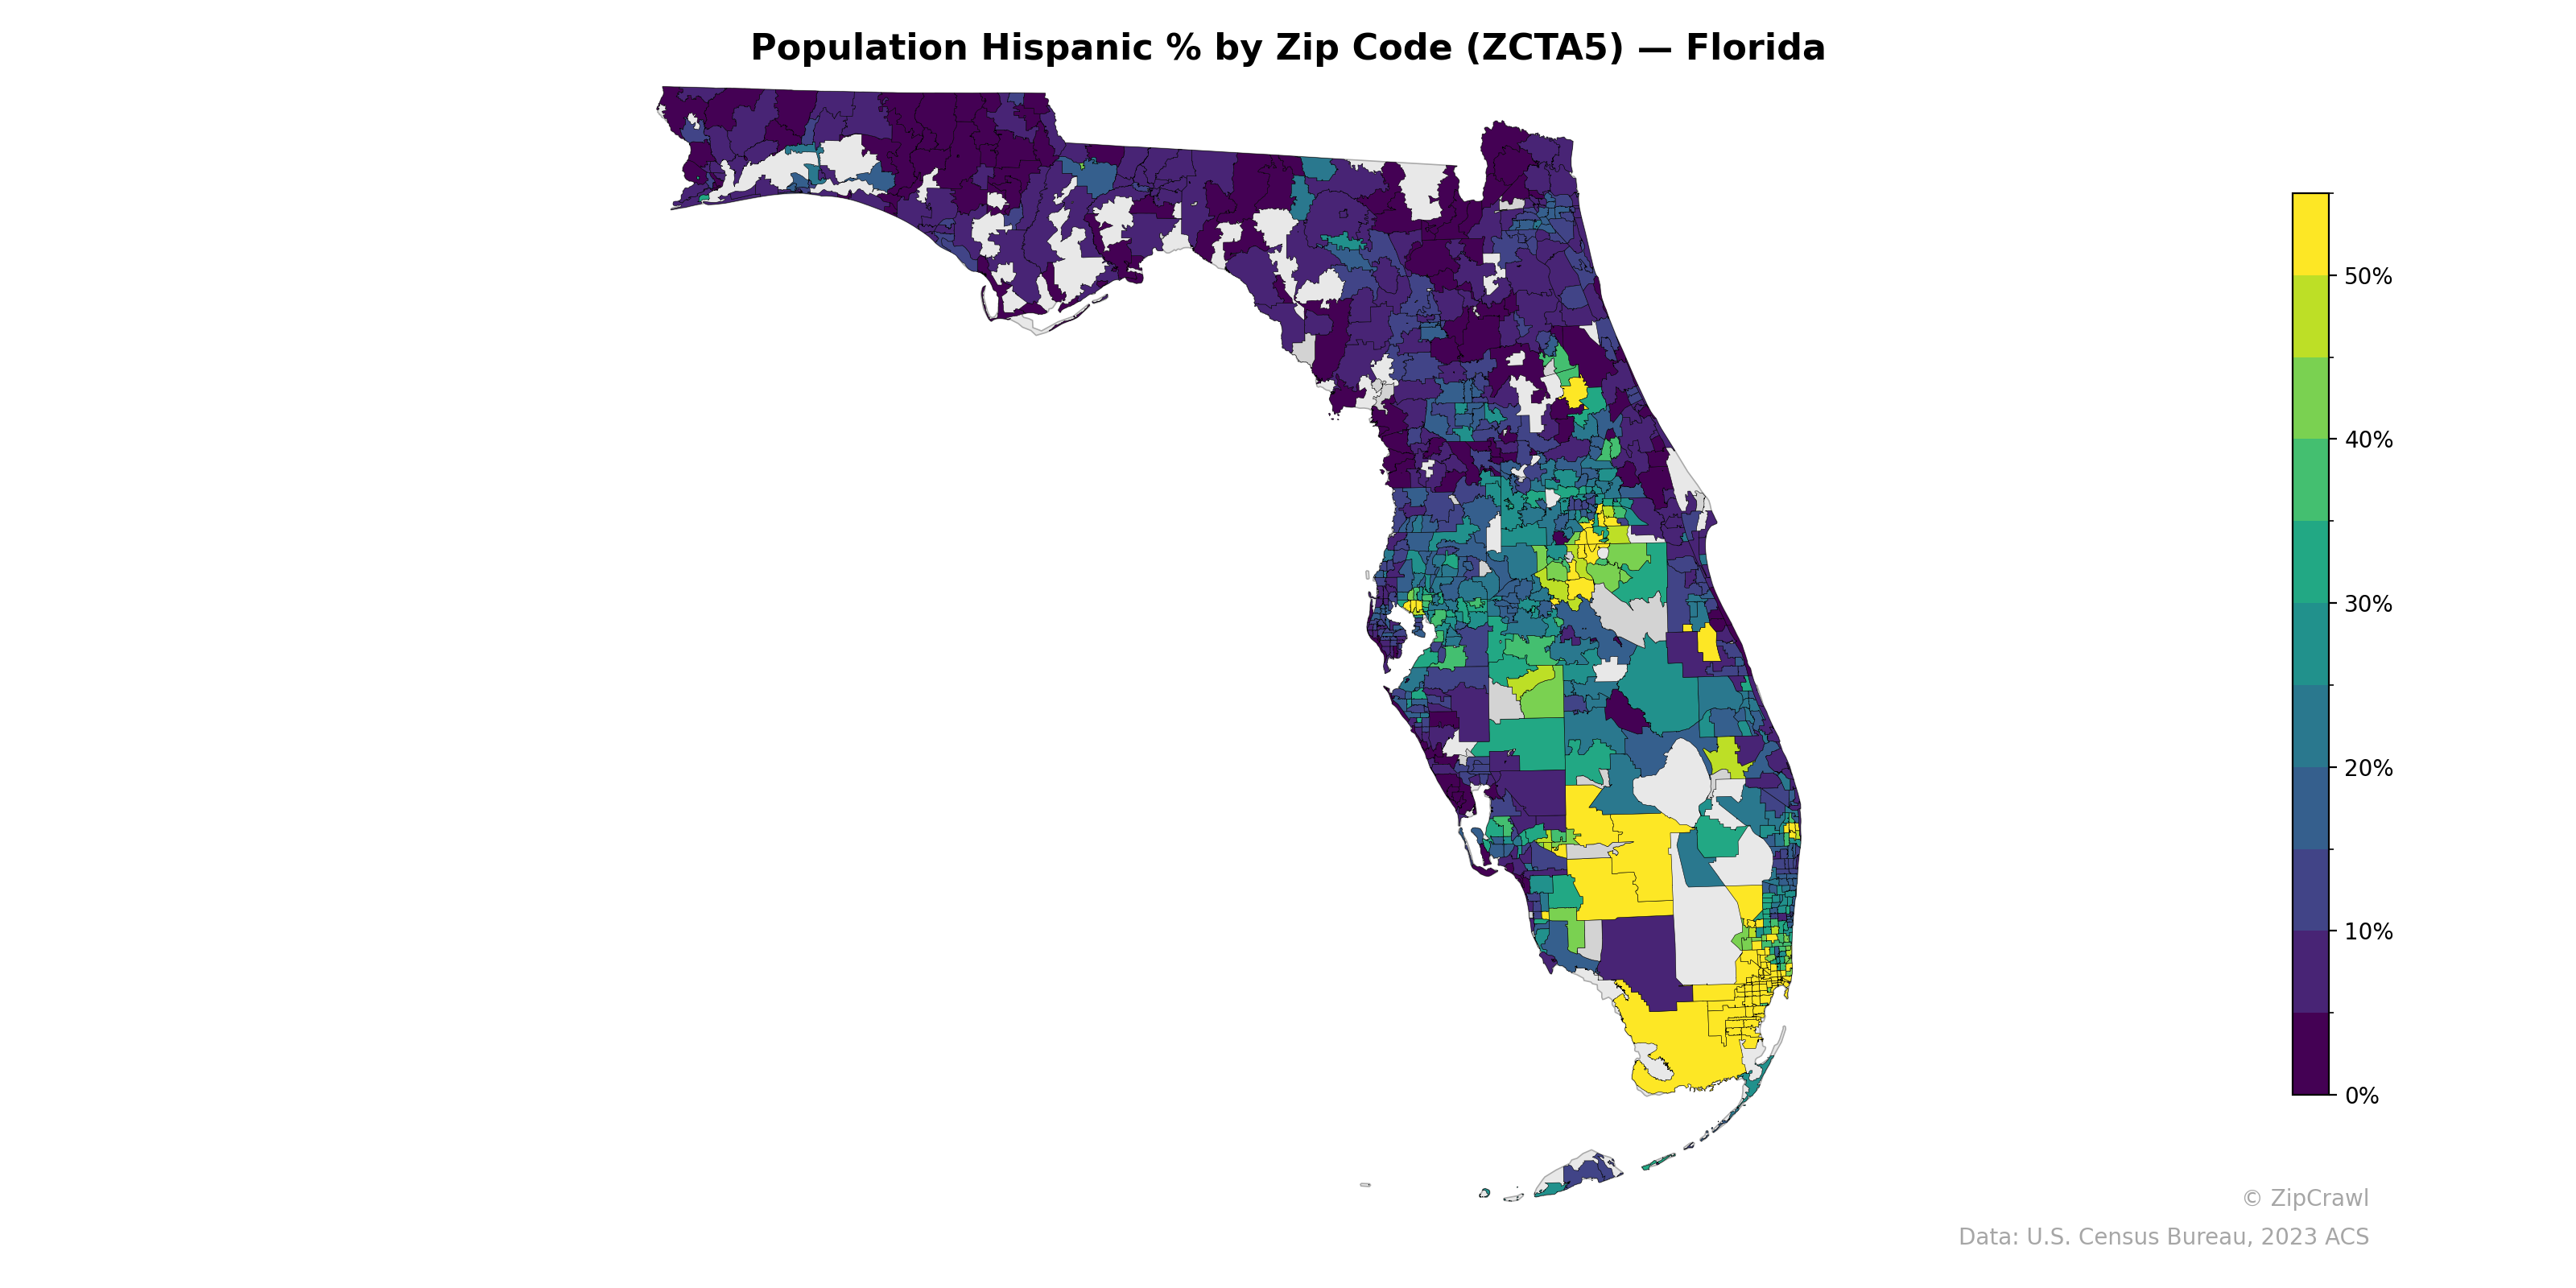
NOTE: Gray indicates insufficient data or a suppressed estimate.
Hispanic population concentration in Florida follows a pronounced south-to-north gradient, with Miami-Dade County zip codes reaching above 50% and forming the state's densest Hispanic cluster, while the Panhandle and northern interior regions remain overwhelmingly below 10%. A secondary corridor of elevated Hispanic percentages extends through Central Florida, particularly in the Osceola and Orange County areas near Orlando, likely reflecting Puerto Rican and other Latin American migration patterns. The contrast between South Florida's yellow-dominated zip codes and the deep purple of the rural north and Big Bend region represents one of the most striking intrastate demographic divides visible at this scale.
Data: U.S. Census Bureau, 2023 ACS
Explore
- Household Average Size by Zip Code (ZCTA5) — Nevada
- Housing Median Monthly Rent ($), by Zip Code (ZCTA5) — Nevada
- Bachelor's Degree or Higher (% of Over 25) by Zip Code (ZCTA5) — Nevada
- High School Graduate (% of Over 25) by Zip Code (ZCTA5) — Nevada
- Housing % of Units Built Since 2010, by Zip Code (ZCTA5) — Nevada
- Housing Owner-Occupied Median Value ($), by Zip Code (ZCTA5) — Nevada
- Housing Owner-Occupied % of Units, by Zip Code (ZCTA5) — Nevada
- % of Population without Health Insurance, by Zip Code (ZCTA5) — Nevada
- % of Households with Broadband Internet, by Zip Code (ZCTA5) — Nevada
- Population Non-Hispanic American Indian % by Zip Code (ZCTA5) — Nevada
- Housing Owner-Occupied Median Value ($), by Zip Code (ZCTA5) — Utah
- Housing Owner-Occupied Median Value ($), by County
- Population Non-Hispanic American Indian % by Zip Code (ZCTA5) — Florida
- High School Graduate (% of Over 25) by Zip Code (ZCTA5) — Florida
- Household Median Income by Zip Code (ZCTA5) — Florida
- Median Age by Zip Code (ZCTA5) — Florida
- Population Non-Hispanic White % by Zip Code (ZCTA5) — Florida
- U.S. Citizens (% of Population Over 18) by Zip Code (ZCTA5) — Florida
- Population Non-Hispanic Asian % by Zip Code (ZCTA5) — California
- % of Population on Food Stamps or SNAP (Last 12 Months), by Zip Code (ZCTA5) — California
- Population Non-Hispanic Black % by Zip Code (ZCTA5) — Florida
- Housing Vacancy Rate by Zip Code (ZCTA5) — Connecticut
- Bachelor's Degree or Higher (% of Over 25) by Zip Code (ZCTA5) — Connecticut
- Population Non-Hispanic Asian % by Zip Code (ZCTA5) — Connecticut
- Housing Owner-Occupied Median Value ($), by Zip Code (ZCTA5) — Louisiana
- % of Households with Broadband Internet, by Zip Code (ZCTA5) — Connecticut
- Population Non-Hispanic American Indian % by Zip Code (ZCTA5) — Connecticut
- Median Age by Zip Code (ZCTA5) — Iowa
- High School Graduate (% of Over 25) by Zip Code (ZCTA5) — Connecticut
- Household Median Income by Zip Code (ZCTA5) — Iowa
- Population Hispanic % by Zip Code (ZCTA5) — Idaho
- Population Hispanic % by Zip Code (ZCTA5) — Colorado
- Population Hispanic % by Zip Code (ZCTA5) — Nevada
- Population Hispanic % by Zip Code (ZCTA5) — Ohio
- Population Hispanic % by Zip Code (ZCTA5) — Iowa
- Population Hispanic % by Zip Code (ZCTA5) — Utah
- Population Hispanic % by Zip Code (ZCTA5) — Texas
- Population Hispanic % by Zip Code (ZCTA5) — Oregon
- Population Hispanic % by Zip Code (ZCTA5) — Hawaii
- Population Hispanic % by Zip Code (ZCTA5) — Maine