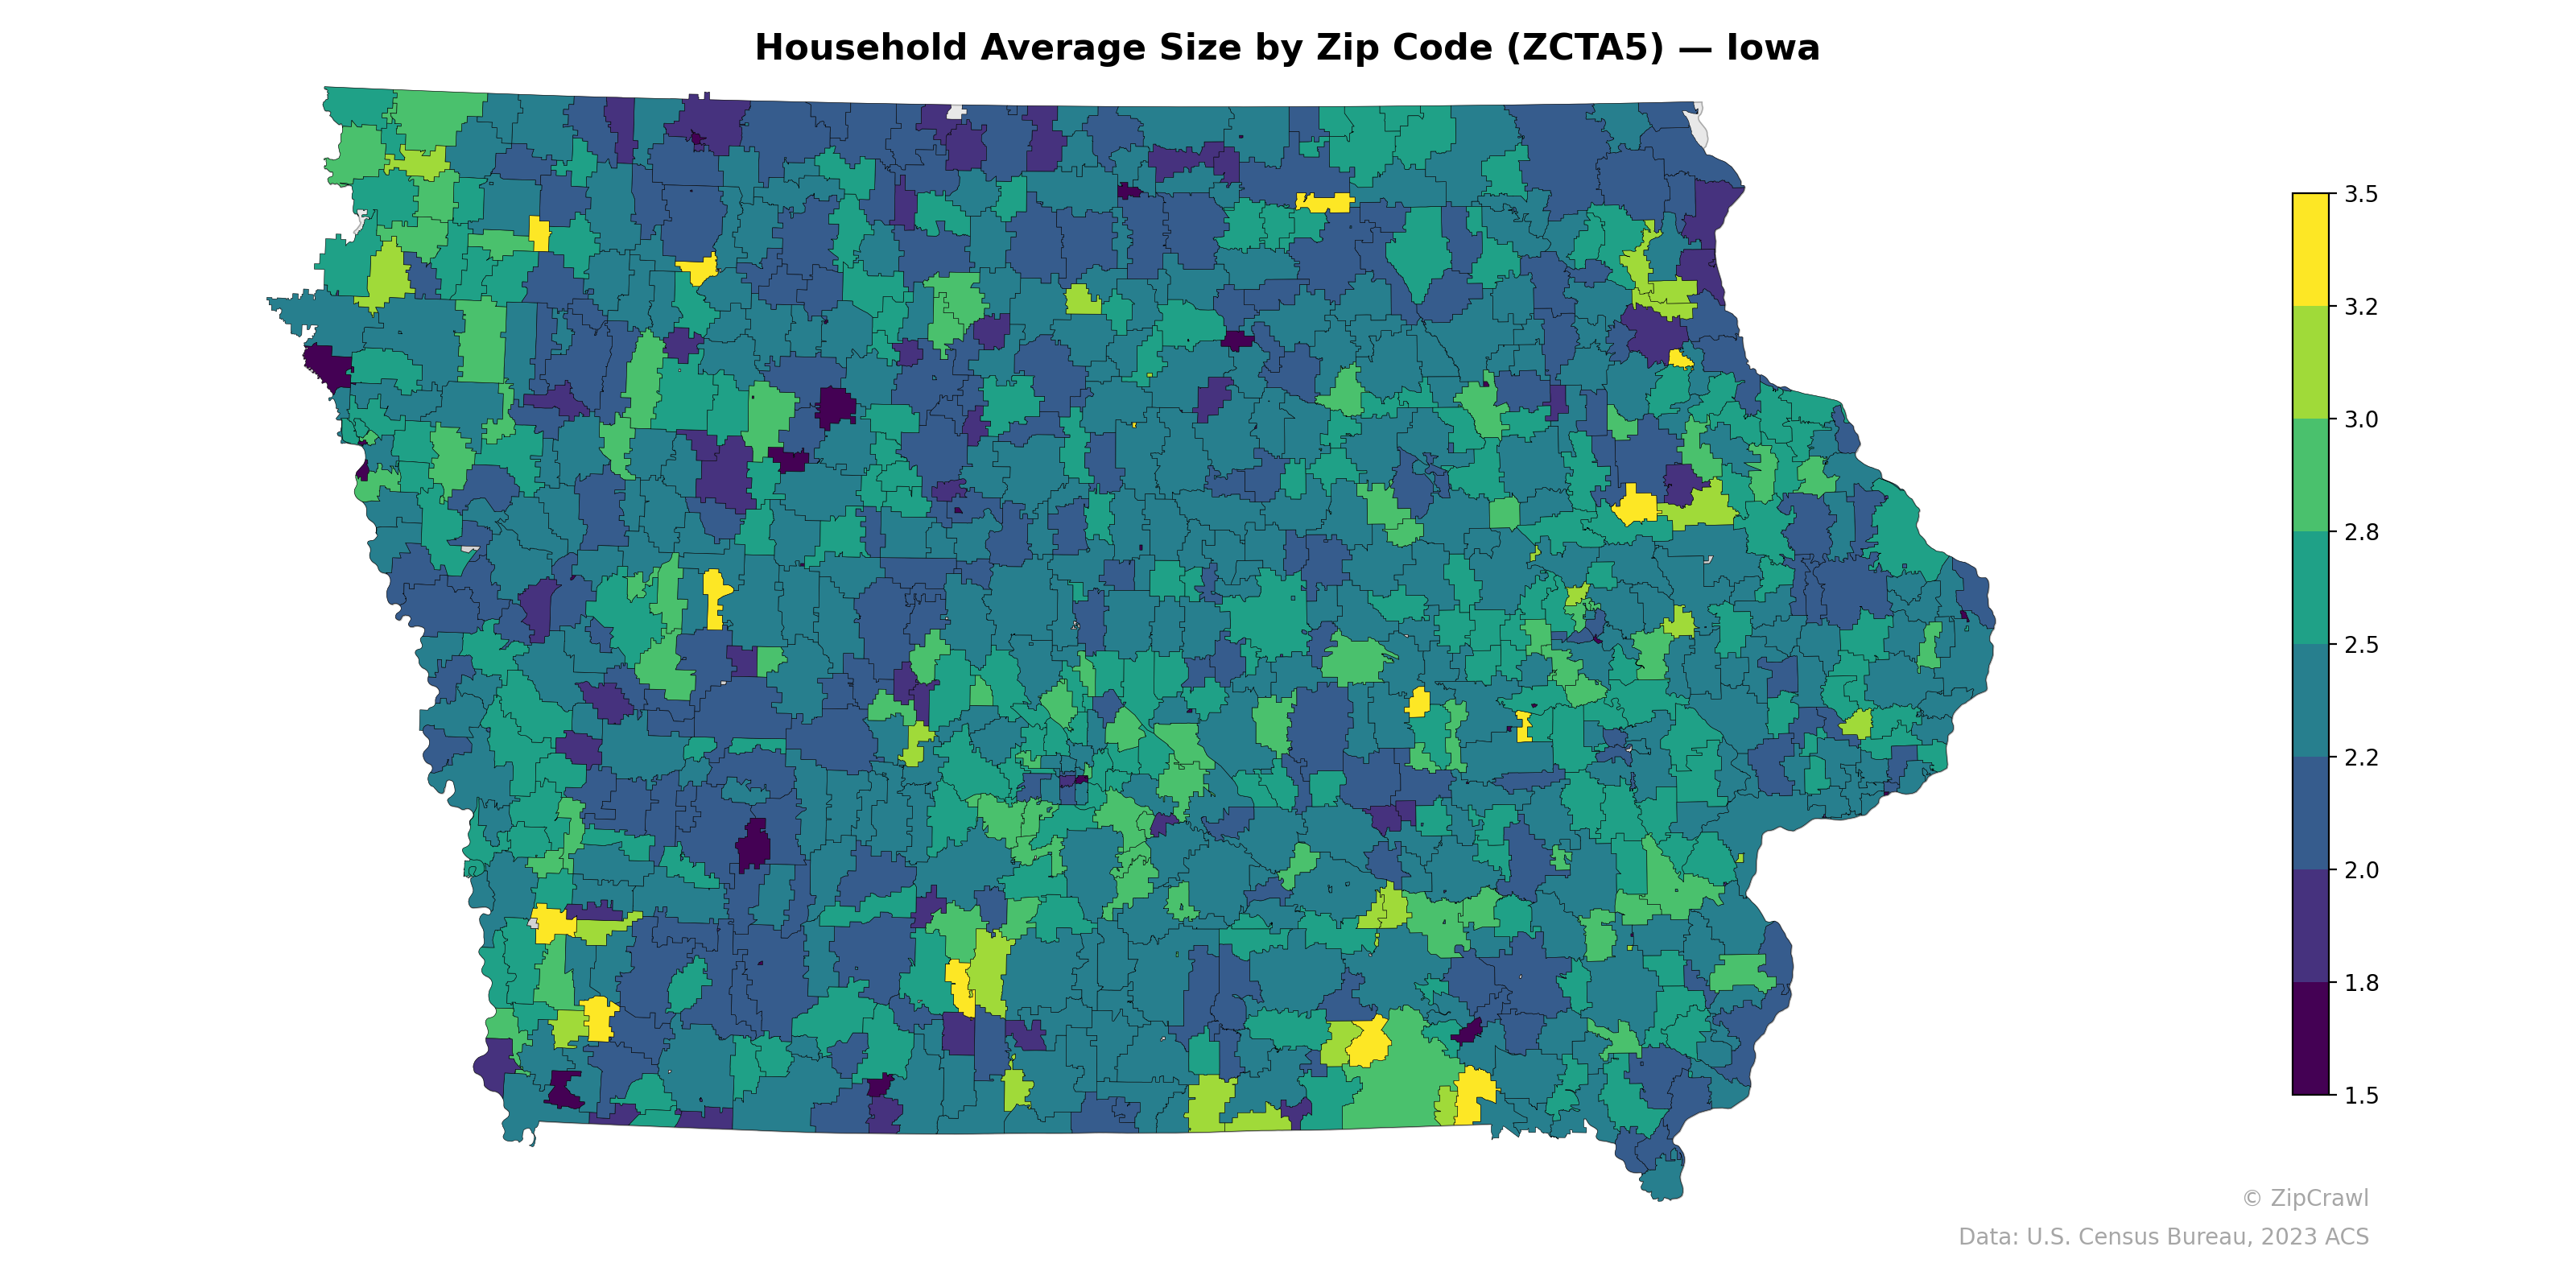
NOTE: Gray indicates insufficient data or a suppressed estimate.
Northwestern Iowa consistently displays higher average household sizes, with numerous zip codes in the 2.8–3.5 range, likely reflecting the region's established agricultural communities and larger family structures among rural and immigrant populations such as those in Sioux County. In contrast, zip codes in the eastern and central portions of the state—particularly around college towns and smaller rural communities—trend toward lower averages in the 2.0–2.4 range, with several dark purple pockets near 1.5 suggesting concentrations of elderly or single-person households. Scattered bright yellow outliers (3.0+) appear near Dubuque, Waterloo, and in south-central Iowa, possibly corresponding to specific communities with younger families or culturally distinct populations.
Data: U.S. Census Bureau, 2023 ACS
Explore
- Median Age by Zip Code (ZCTA5) — Florida
- Housing Median Monthly Rent ($), by Zip Code (ZCTA5) — Iowa
- Population Non-Hispanic American Indian % by Zip Code (ZCTA5) — Iowa
- Bachelor's Degree or Higher (% of Over 25) by Zip Code (ZCTA5) — Iowa
- Housing % of Units Built Since 2010, by Zip Code (ZCTA5) — Iowa
- Housing Owner-Occupied Median Value ($), by Zip Code (ZCTA5) — Iowa
- Housing Owner-Occupied % of Units, by Zip Code (ZCTA5) — Iowa
- % of Population without Health Insurance, by Zip Code (ZCTA5) — Iowa
- % of Households with Broadband Internet, by Zip Code (ZCTA5) — Iowa
- High School Graduate (% of Over 25) by Zip Code (ZCTA5) — Iowa
- Housing Owner-Occupied Median Value ($), by County
- High School Graduate (% of Over 25) by Zip Code (ZCTA5) — New York
- High School Graduate (% of Over 25) by Zip Code (ZCTA5) — Dallas Metro
- High School Graduate (% of Over 25) by Zip Code (ZCTA5) — Florida
- Population Hispanic % by Zip Code (ZCTA5) — Florida
- Household Median Income by Zip Code (ZCTA5) — Florida
- Population Non-Hispanic Black % by Zip Code (ZCTA5) — Florida
- Population Non-Hispanic Asian % by Zip Code (ZCTA5) — California
- % of Population on Food Stamps or SNAP (Last 12 Months), by Zip Code (ZCTA5) — California
- U.S. Citizens (% of Population Over 18) by Zip Code (ZCTA5) — Florida
- Population Non-Hispanic American Indian % by Zip Code (ZCTA5) — Florida
- Population Non-Hispanic White % by Zip Code (ZCTA5) — Florida
- Housing % of Units Built Since 2010, by Zip Code (ZCTA5) — Connecticut
- Population Non-Hispanic American Indian % by Zip Code (ZCTA5) — Connecticut
- Married Couple (% of all Households) by Zip Code (ZCTA5) — Connecticut
- High School Graduate (% of Over 25) by Zip Code (ZCTA5) — Connecticut
- Population Hispanic % by Zip Code (ZCTA5) — Mississippi
- Household Median Income by Zip Code (ZCTA5) — Iowa
- Median Age by Zip Code (ZCTA5) — Iowa
- Housing Median Monthly Rent ($), by Zip Code (ZCTA5) — Nevada
- Household Average Size by Zip Code (ZCTA5) — Idaho
- Household Average Size by Zip Code (ZCTA5) — Utah
- Household Average Size by Zip Code (ZCTA5) — Ohio
- Household Average Size by Zip Code (ZCTA5) — Indiana
- Household Average Size by Zip Code (ZCTA5) — Alaska
- Household Average Size by Zip Code (ZCTA5) — Maine
- Household Average Size by Zip Code (ZCTA5) — Hawaii
- Household Average Size by Zip Code (ZCTA5) — Texas
- Household Average Size by Zip Code (ZCTA5) — Illinois
- Household Average Size by Zip Code (ZCTA5) — Oregon