NOTE: Gray indicates insufficient data or a suppressed estimate.
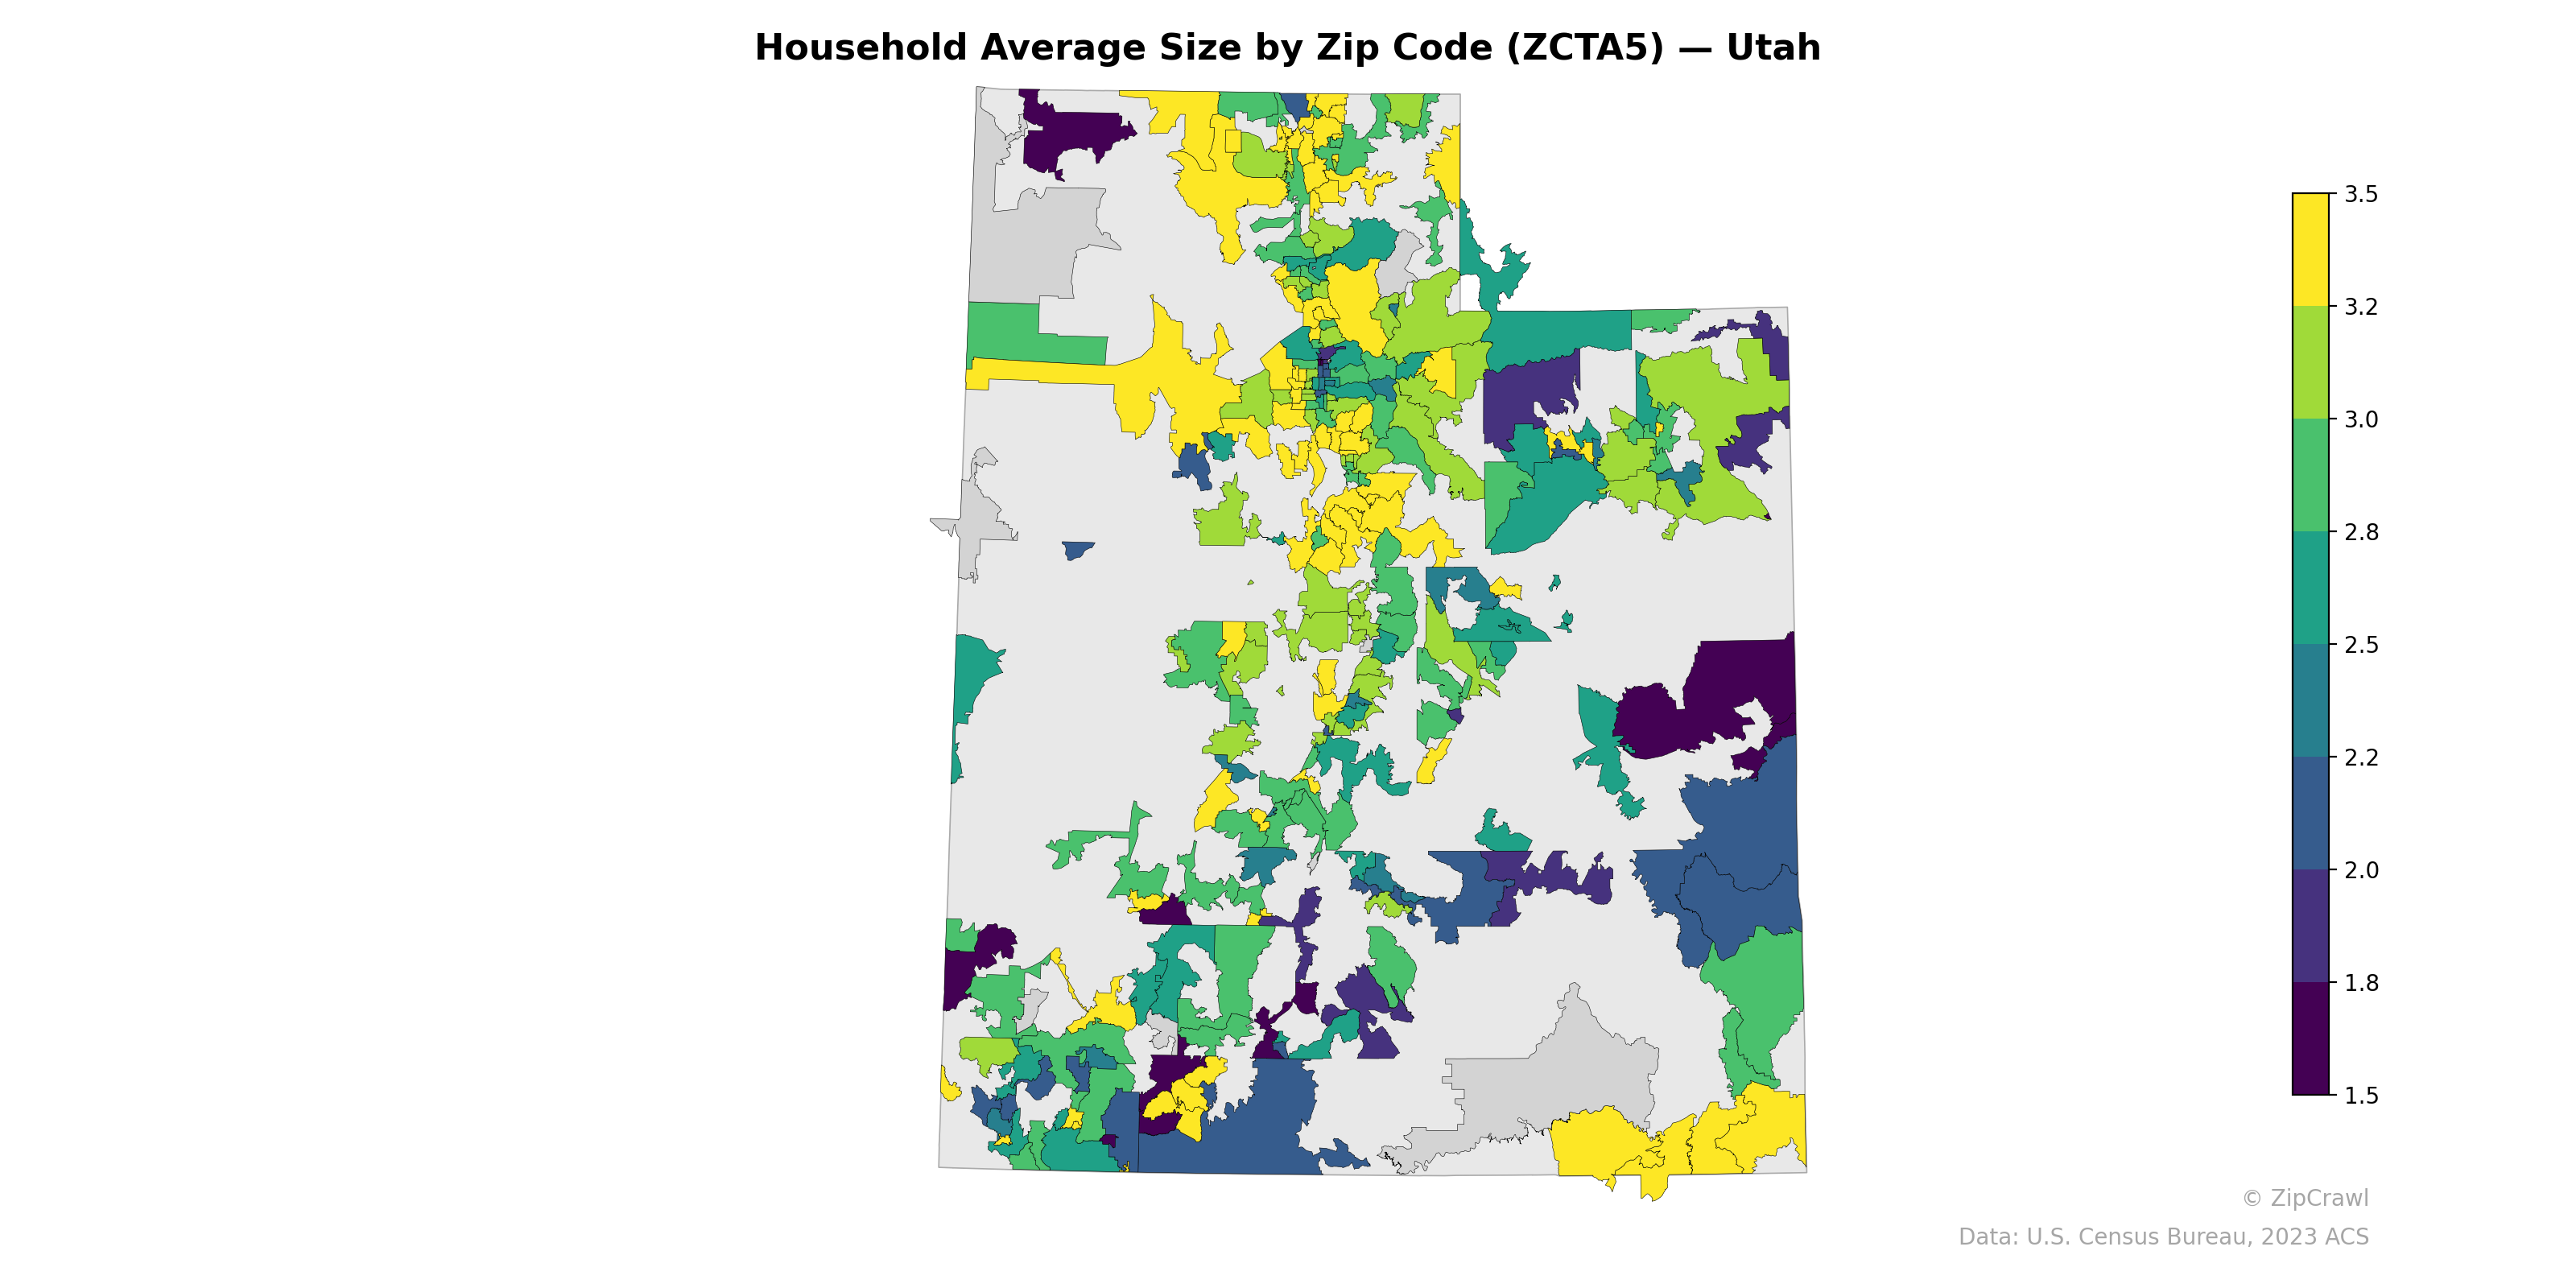
Northern Utah's Wasatch Front corridor displays notable variation, with many suburban zip codes in Utah and Davis counties reaching household sizes above 3.5 (bright yellow), while adjacent urban cores in Salt Lake City trend lower around 2.0–2.5. Rural eastern and southeastern Utah zip codes consistently register among the lowest household sizes in the state, with several areas falling below 2.0, likely reflecting older or smaller household demographics in those sparsely populated regions. The southwestern corner around St. George shows a mixed pattern, with pockets of both higher and lower household sizes suggesting varied development stages and demographic compositions within that rapidly growing area.
Data: U.S. Census Bureau, 2023 ACS
Explore
- High School Graduate (% of Over 25) by Zip Code (ZCTA5) — Florida
- U.S. Citizens (% of Population Over 18) by Zip Code (ZCTA5) — Florida
- Housing % of Units Built Since 2010, by Zip Code (ZCTA5) — Utah
- Bachelor's Degree or Higher (% of Over 25) by Zip Code (ZCTA5) — Utah
- Population Non-Hispanic American Indian % by Zip Code (ZCTA5) — Utah
- Housing Median Monthly Rent ($), by Zip Code (ZCTA5) — Utah
- % of Population without Health Insurance, by Zip Code (ZCTA5) — Utah
- Housing Owner-Occupied Median Value ($), by Zip Code (ZCTA5) — Utah
- Housing Owner-Occupied % of Units, by Zip Code (ZCTA5) — Utah
- High School Graduate (% of Over 25) by Zip Code (ZCTA5) — Utah
- % of Households with Broadband Internet, by Zip Code (ZCTA5) — Utah
- Housing Owner-Occupied Median Value ($), by County
- Population Non-Hispanic Black % by Zip Code (ZCTA5) — Florida
- Population Non-Hispanic American Indian % by Zip Code (ZCTA5) — Florida
- Household Median Income by Zip Code (ZCTA5) — Florida
- Median Age by Zip Code (ZCTA5) — Florida
- % of Population on Food Stamps or SNAP (Last 12 Months), by Zip Code (ZCTA5) — California
- Population Non-Hispanic White % by Zip Code (ZCTA5) — Florida
- High School Graduate (% of Over 25) by Zip Code (ZCTA5) — Georgia
- Population Non-Hispanic Asian % by Zip Code (ZCTA5) — California
- Population Hispanic % by Zip Code (ZCTA5) — Florida
- Married Couple (% of all Households) by Zip Code (ZCTA5) — Connecticut
- High School Graduate (% of Over 25) by Zip Code (ZCTA5) — Connecticut
- Housing Vacancy Rate by Zip Code (ZCTA5) — Connecticut
- Housing Median Monthly Rent ($), by Zip Code (ZCTA5) — Nevada
- Household Median Income by Zip Code (ZCTA5) — Iowa
- Median Age by Zip Code (ZCTA5) — Iowa
- Population Hispanic % by Zip Code (ZCTA5) — Mississippi
- Population Non-Hispanic American Indian % by Zip Code (ZCTA5) — Connecticut
- Bachelor's Degree or Higher (% of Over 25) by Zip Code (ZCTA5) — Connecticut
- Household Average Size by Zip Code (ZCTA5) — Iowa
- Household Average Size by Zip Code (ZCTA5) — Ohio
- Household Average Size by Zip Code (ZCTA5) — Alaska
- Household Average Size by Zip Code (ZCTA5) — Hawaii
- Household Average Size by Zip Code (ZCTA5) — Idaho
- Household Average Size by Zip Code (ZCTA5) — Maine
- Household Average Size by Zip Code (ZCTA5) — Texas
- Household Average Size by Zip Code (ZCTA5) — Nevada
- Household Average Size by Zip Code (ZCTA5) — Oregon
- Household Average Size by Zip Code (ZCTA5) — Kansas