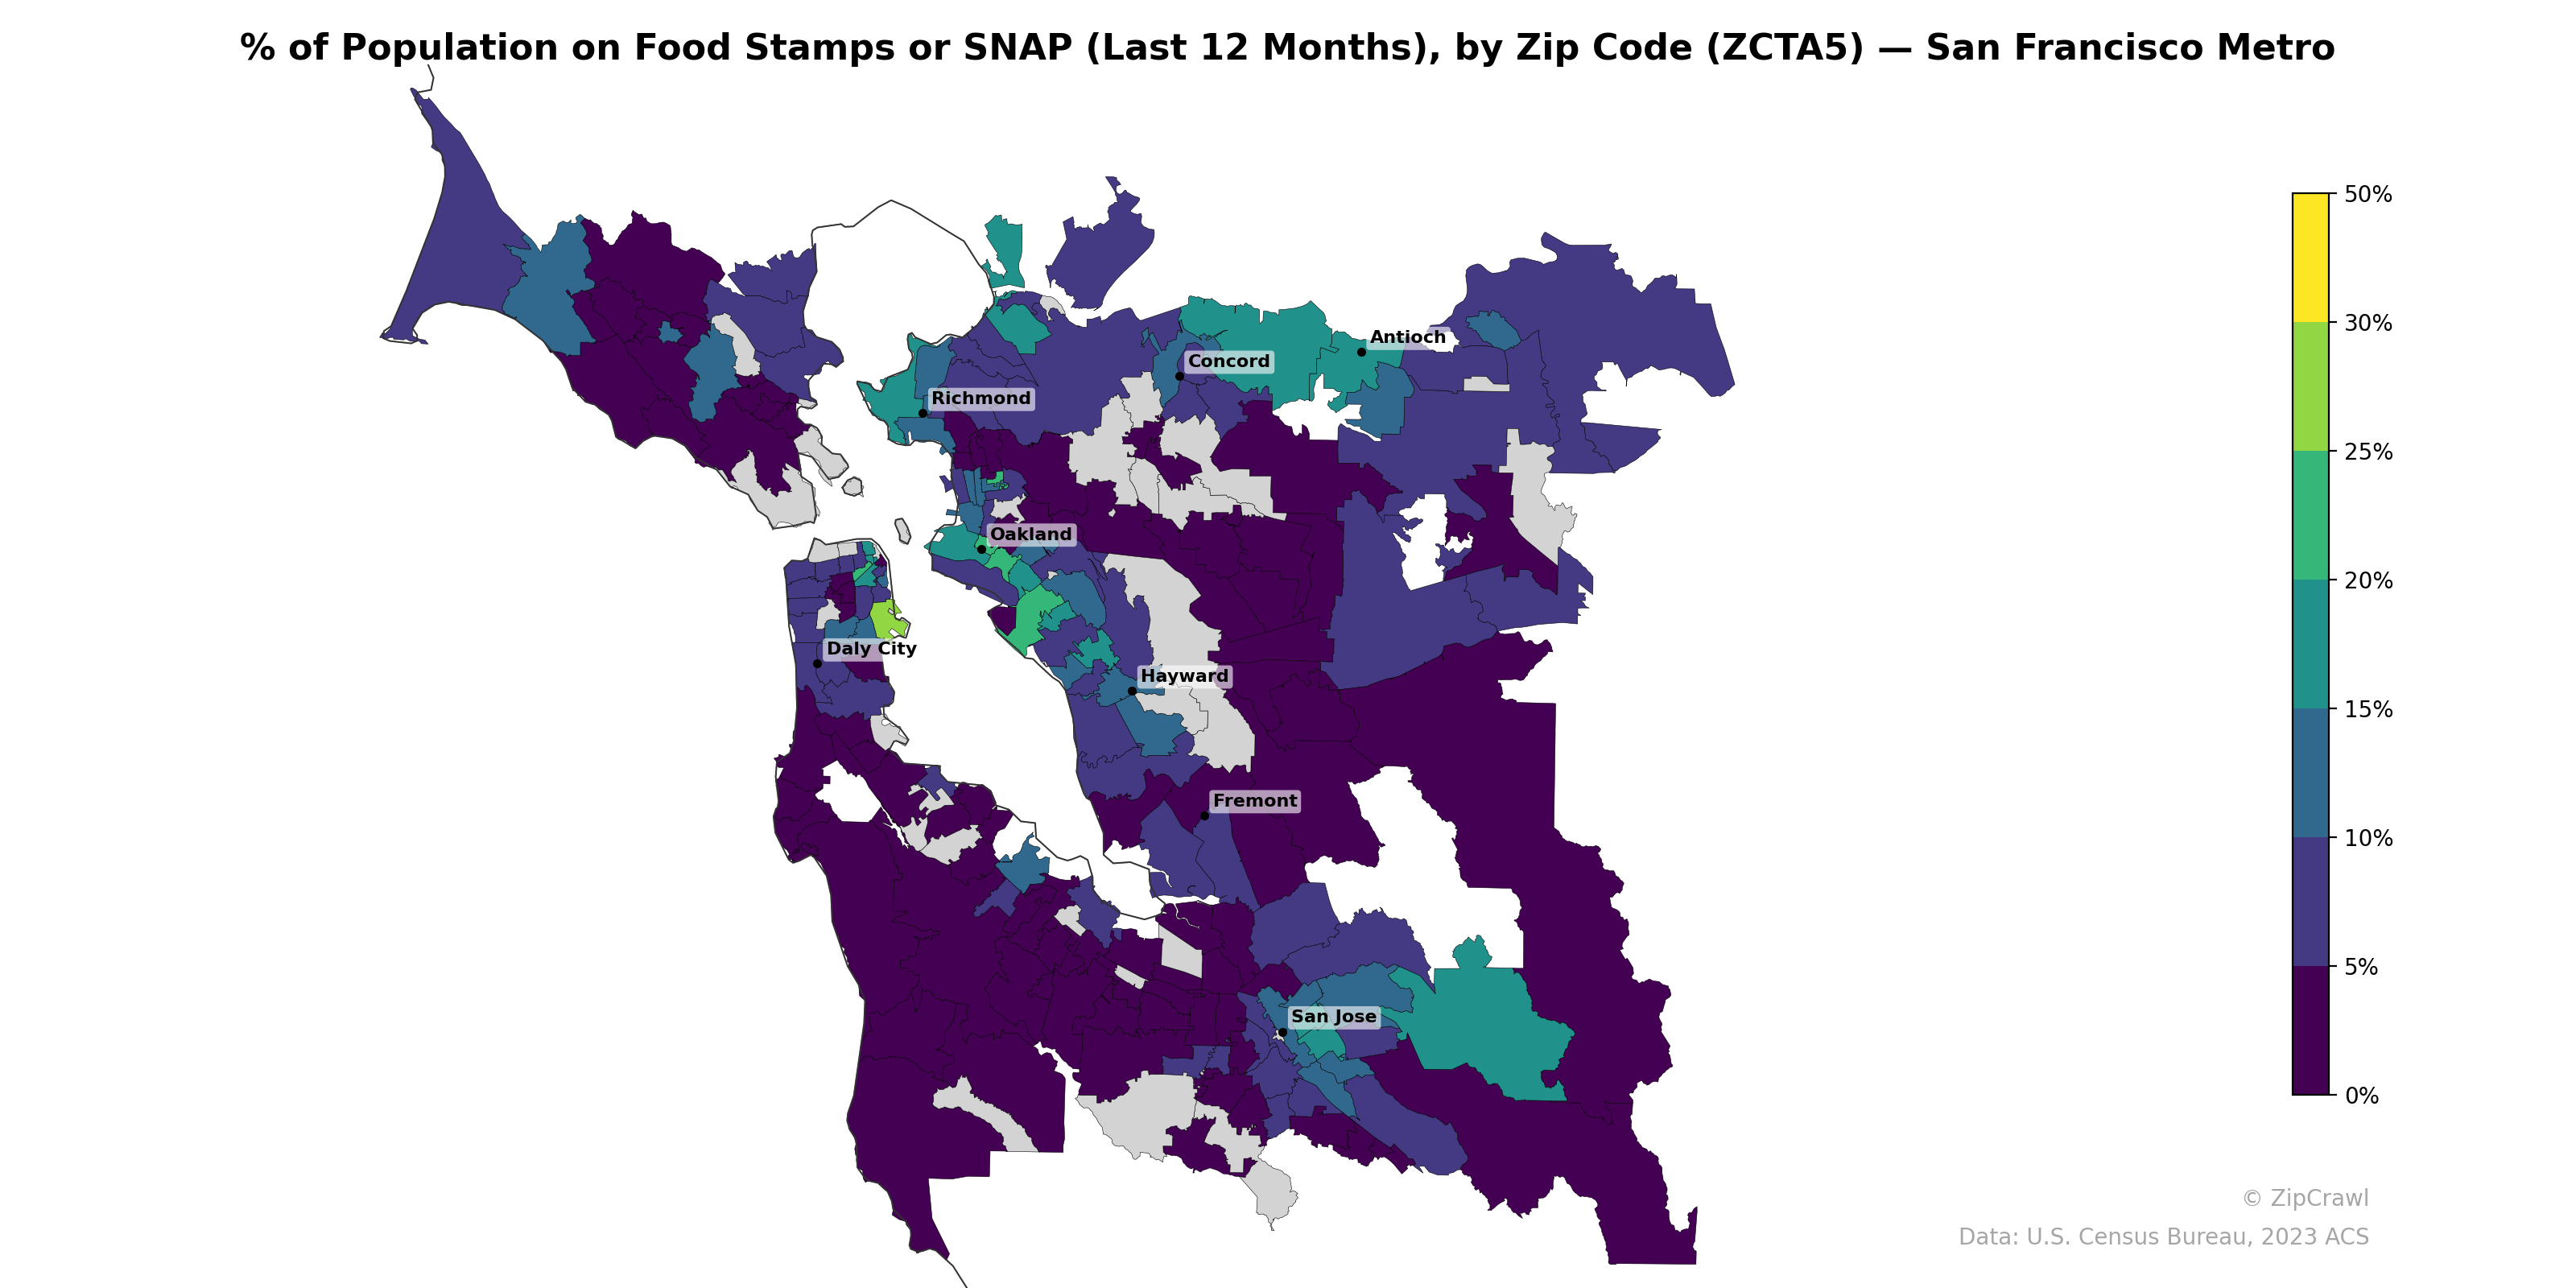
NOTE: Gray indicates insufficient data or a suppressed estimate.
Higher SNAP participation rates cluster prominently in East Oakland, parts of Richmond, and eastern San Jose, where several zip codes reach 20–30% or above, reflecting concentrated economic hardship in these historically underserved communities. In sharp contrast, zip codes spanning much of western San Francisco, the Peninsula corridor through Daly City southward, and affluent East Bay suburbs like Fremont and the Tri-Valley area register well below 5%. The geographic gradient is particularly stark across the Oakland–Berkeley axis, where adjacent zip codes can differ by 15–20 percentage points, underscoring hyperlocal disparities in food assistance need within short distances.
Data: U.S. Census Bureau, 2023 ACS
Explore
- Median Age by Zip Code (ZCTA5) — Chicago Metro
- Population Non-Hispanic Black % by Zip Code (ZCTA5) — Detroit Metro
- Population Non-Hispanic White % by Zip Code (ZCTA5) — Detroit Metro
- U.S. Citizens (% of Population Over 18) by Zip Code (ZCTA5) — Detroit Metro
- Population Non-Hispanic American Indian % by Zip Code (ZCTA5) — Detroit Metro
- Population Hispanic % by Zip Code (ZCTA5) — Detroit Metro
- Household Median Income by Zip Code (ZCTA5) — Detroit Metro
- High School Graduate (% of Over 25) by Zip Code (ZCTA5) — Detroit Metro
- Median Age by Zip Code (ZCTA5) — Detroit Metro
- Population Non-Hispanic Asian % by Zip Code (ZCTA5) — San Francisco Metro
- High School Graduate (% of Over 25) by Zip Code (ZCTA5) — Washington D.C.
- % of Population without Health Insurance, by County
- Household Median Income by Zip Code (ZCTA5) — Chicago Metro
- Population Non-Hispanic White % by Zip Code (ZCTA5) — Chicago Metro
- Population Non-Hispanic Asian % by Zip Code (ZCTA5) — Los Angeles Metro
- U.S. Citizens (% of Population Over 18) by Zip Code (ZCTA5) — Chicago Metro
- Population Non-Hispanic Black % by Zip Code (ZCTA5) — Chicago Metro
- Population Hispanic % by Zip Code (ZCTA5) — Chicago Metro
- Population Non-Hispanic American Indian % by Zip Code (ZCTA5) — Chicago Metro
- High School Graduate (% of Over 25) by Zip Code (ZCTA5) — Chicago Metro
- Housing Owner-Occupied Median Value ($), by Zip Code (ZCTA5) — Boston Metro
- % of Population without Health Insurance, by Zip Code (ZCTA5) — Boston Metro
- Housing Median Monthly Rent ($), by Zip Code (ZCTA5) — Boston Metro
- Population Hispanic % by Zip Code (ZCTA5) — Boston Metro
- Population Non-Hispanic White % by Zip Code (ZCTA5) — Boston Metro
- Population Non-Hispanic Black % by Zip Code (ZCTA5) — Boston Metro
- Bachelor's Degree or Higher (% of Over 25) by Zip Code (ZCTA5) — Boston Metro
- % of Households with Broadband Internet, by Zip Code (ZCTA5) — Boston Metro
- Housing Owner-Occupied % of Units, by Zip Code (ZCTA5) — Boston Metro
- Household Median Income by Zip Code (ZCTA5) — Boston Metro
- % of Population on Food Stamps or SNAP (Last 12 Months), by Zip Code (ZCTA5) — San Diego Metro
- % of Population on Food Stamps or SNAP (Last 12 Months), by Zip Code (ZCTA5) — Tampa Metro
- % of Population on Food Stamps or SNAP (Last 12 Months), by Zip Code (ZCTA5) — San Antonio Metro
- % of Population on Food Stamps or SNAP (Last 12 Months), by Zip Code (ZCTA5) — Boston Metro
- % of Population on Food Stamps or SNAP (Last 12 Months), by Zip Code (ZCTA5) — Miami Metro
- % of Population on Food Stamps or SNAP (Last 12 Months), by Zip Code (ZCTA5) — St. Louis Metro
- % of Population on Food Stamps or SNAP (Last 12 Months), by Zip Code (ZCTA5) — Dallas Metro
- % of Population on Food Stamps or SNAP (Last 12 Months), by Zip Code (ZCTA5) — Detroit Metro
- % of Population on Food Stamps or SNAP (Last 12 Months), by Zip Code (ZCTA5) — Orlando Metro
- % of Population on Food Stamps or SNAP (Last 12 Months), by Zip Code (ZCTA5) — Phoenix Metro