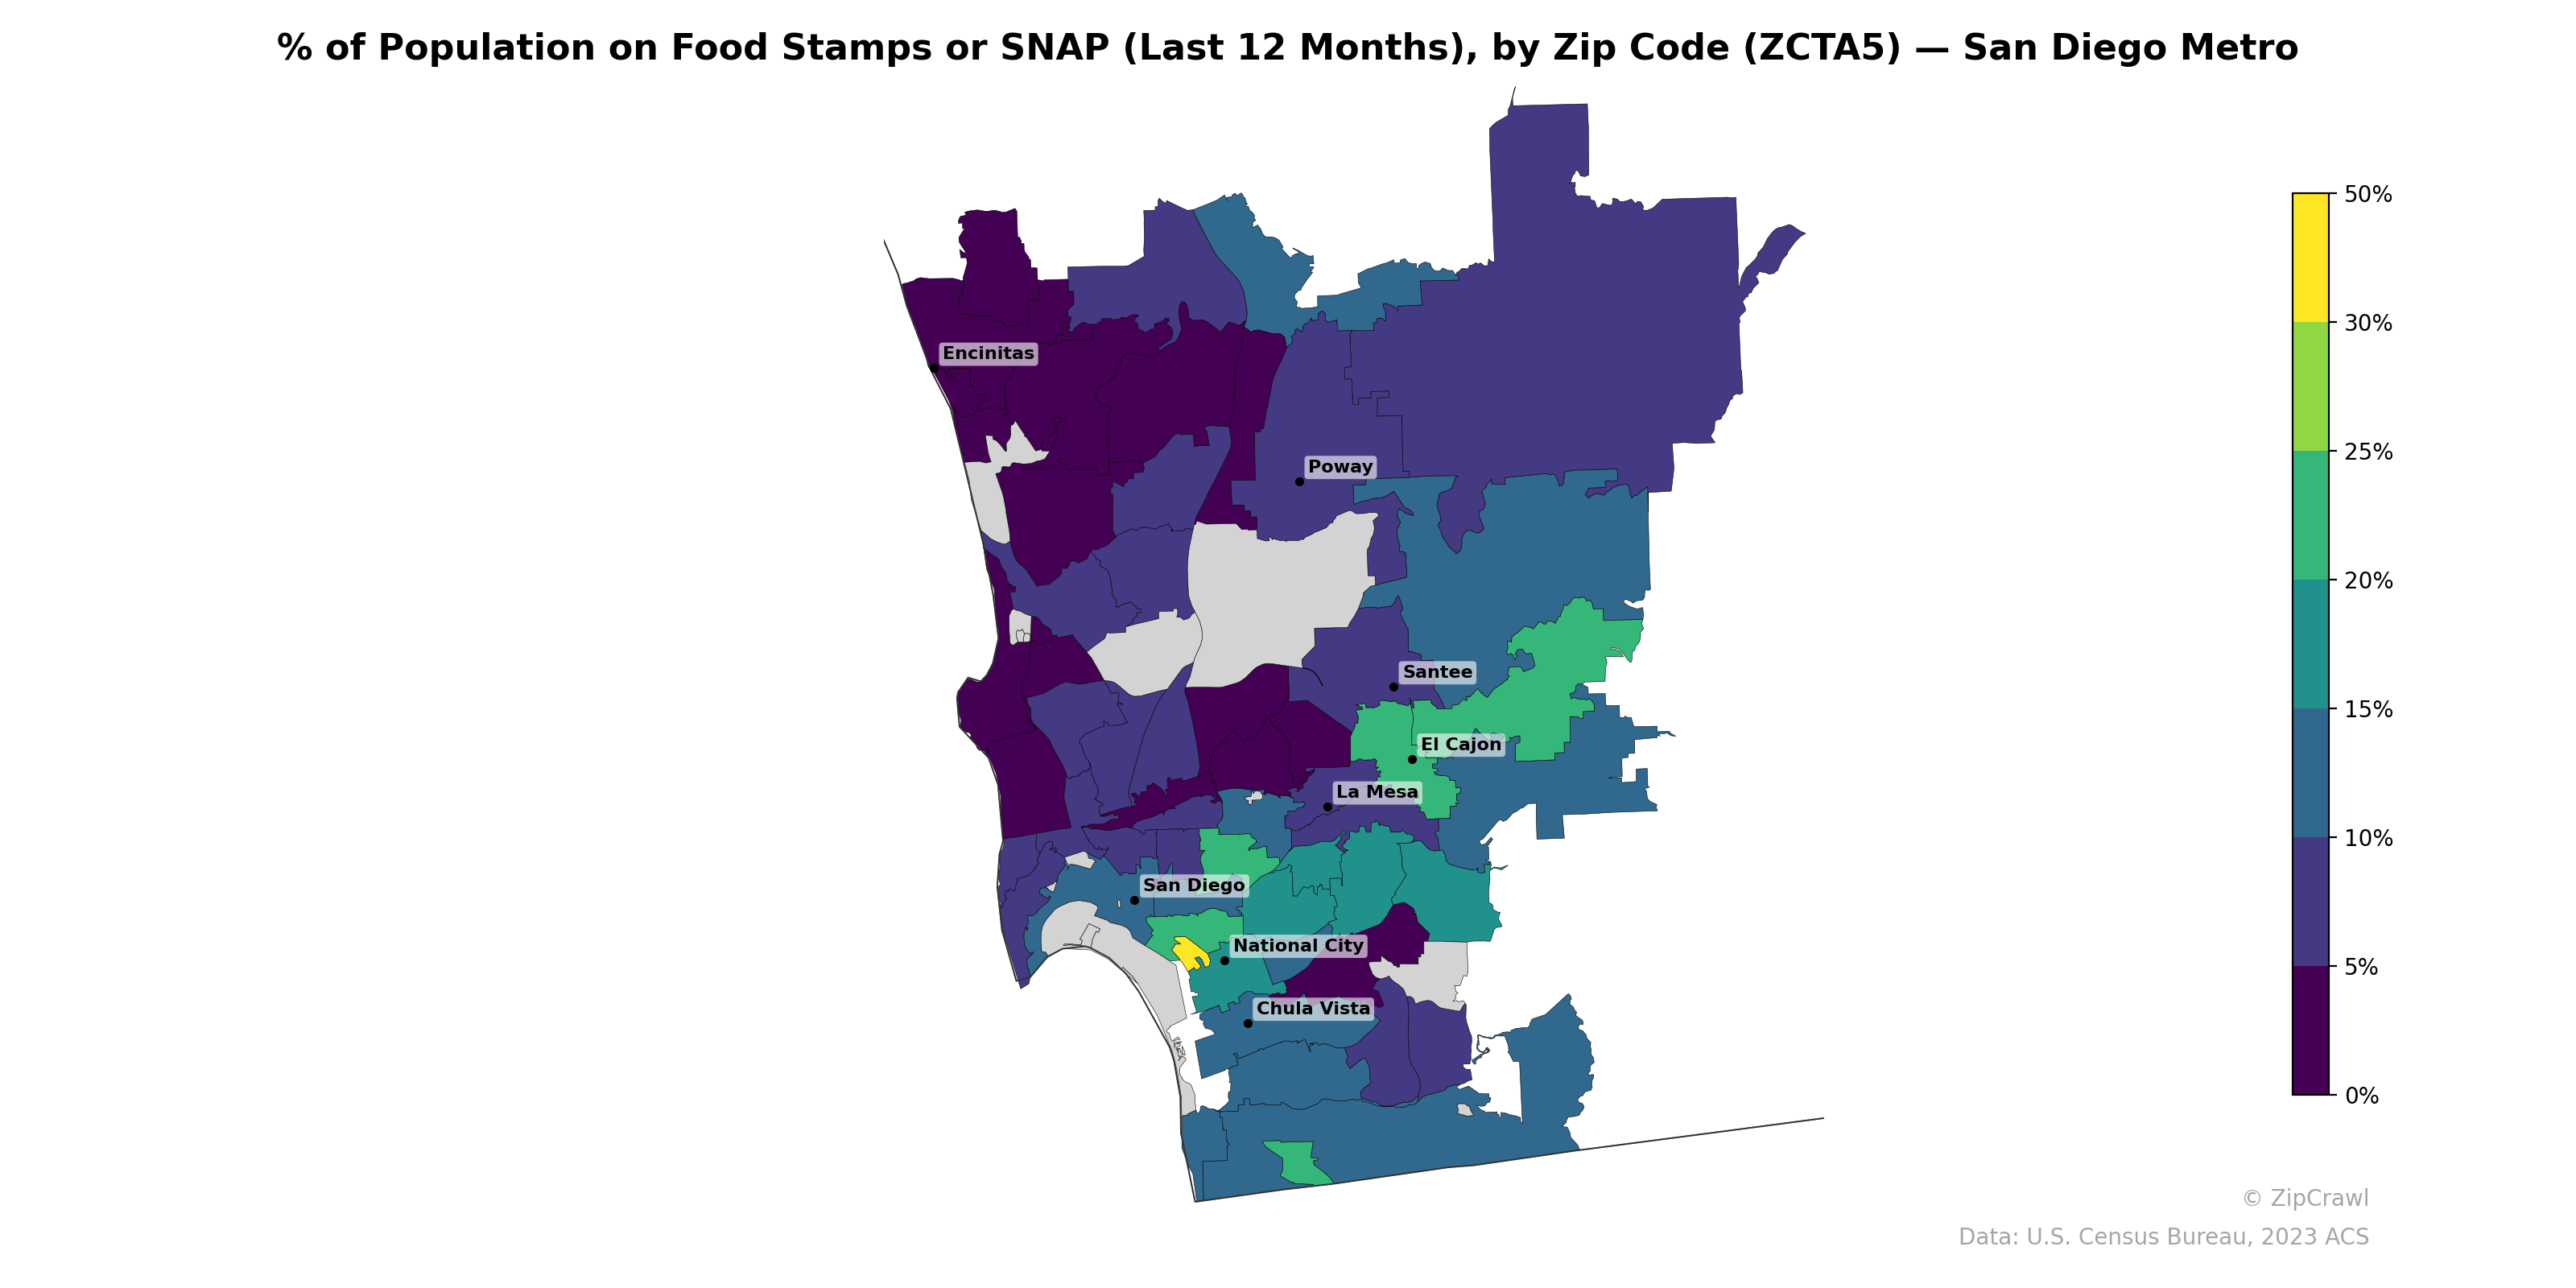
NOTE: Gray indicates insufficient data or a suppressed estimate.
The highest SNAP participation rates in the San Diego metro concentrate in two distinct clusters: the southeastern inland areas around El Cajon, Santee, and National City, where rates reach 15–25% or higher, and a small pocket near National City approaching 50%. Coastal communities from Encinitas southward through central San Diego consistently show the lowest participation rates, generally below 5%, creating a sharp east-west gradient in food assistance reliance. The far northeastern exurban zip codes display moderately low rates despite their distance from the coast, suggesting that income levels in those areas diverge from the pattern seen in other inland communities closer to the urban core.
Data: U.S. Census Bureau, 2023 ACS
Explore
- Housing Owner-Occupied Median Value ($), by Zip Code (ZCTA5) — Chicago Metro
- High School Graduate (% of Over 25) by Zip Code (ZCTA5) — Denver Metro
- Median Age by Zip Code (ZCTA5) — Denver Metro
- Population Non-Hispanic White % by Zip Code (ZCTA5) — Denver Metro
- Population Non-Hispanic American Indian % by Zip Code (ZCTA5) — Denver Metro
- U.S. Citizens (% of Population Over 18) by Zip Code (ZCTA5) — Denver Metro
- Population Hispanic % by Zip Code (ZCTA5) — Denver Metro
- Household Median Income by Zip Code (ZCTA5) — Denver Metro
- Population Non-Hispanic Asian % by Zip Code (ZCTA5) — San Diego Metro
- Population Non-Hispanic Black % by Zip Code (ZCTA5) — Denver Metro
- Population Non-Hispanic American Indian % by County
- Housing Vacancy Rate by Zip Code (ZCTA5) — Chicago Metro
- Married Couple (% of all Households) by Zip Code (ZCTA5) — Chicago Metro
- Housing Median Monthly Rent ($), by Zip Code (ZCTA5) — Chicago Metro
- Household Average Size by Zip Code (ZCTA5) — Chicago Metro
- % of Households with Broadband Internet, by Zip Code (ZCTA5) — Chicago Metro
- Bachelor's Degree or Higher (% of Over 25) by Zip Code (ZCTA5) — Chicago Metro
- % of Population without Health Insurance, by Zip Code (ZCTA5) — Chicago Metro
- Housing Owner-Occupied % of Units, by Zip Code (ZCTA5) — Chicago Metro
- Housing % of Units Built Since 2010, by Zip Code (ZCTA5) — Chicago Metro
- Housing % of Units Built Since 2010, by Zip Code (ZCTA5) — Denver Metro
- Housing Owner-Occupied % of Units, by Zip Code (ZCTA5) — Denver Metro
- Household Average Size by Zip Code (ZCTA5) — Denver Metro
- Bachelor's Degree or Higher (% of Over 25) by Zip Code (ZCTA5) — Denver Metro
- % of Households with Broadband Internet, by Zip Code (ZCTA5) — Denver Metro
- Married Couple (% of all Households) by Zip Code (ZCTA5) — Denver Metro
- Bachelor's Degree or Higher (% of Over 25) by Zip Code (ZCTA5) — Orlando Metro
- % of Population without Health Insurance, by Zip Code (ZCTA5) — Denver Metro
- Housing Owner-Occupied Median Value ($), by Zip Code (ZCTA5) — Denver Metro
- Housing Median Monthly Rent ($), by Zip Code (ZCTA5) — Denver Metro
- % of Population on Food Stamps or SNAP (Last 12 Months), by Zip Code (ZCTA5) — Dallas Metro
- % of Population on Food Stamps or SNAP (Last 12 Months), by Zip Code (ZCTA5) — Detroit Metro
- % of Population on Food Stamps or SNAP (Last 12 Months), by Zip Code (ZCTA5) — Tampa Metro
- % of Population on Food Stamps or SNAP (Last 12 Months), by Zip Code (ZCTA5) — San Antonio Metro
- % of Population on Food Stamps or SNAP (Last 12 Months), by Zip Code (ZCTA5) — Denver Metro
- % of Population on Food Stamps or SNAP (Last 12 Months), by Zip Code (ZCTA5) — Chicago Metro
- % of Population on Food Stamps or SNAP (Last 12 Months), by Zip Code (ZCTA5) — St. Louis Metro
- % of Population on Food Stamps or SNAP (Last 12 Months), by Zip Code (ZCTA5) — Boston Metro
- % of Population on Food Stamps or SNAP (Last 12 Months), by Zip Code (ZCTA5) — Miami Metro
- % of Population on Food Stamps or SNAP (Last 12 Months), by Zip Code (ZCTA5) — San Francisco Metro