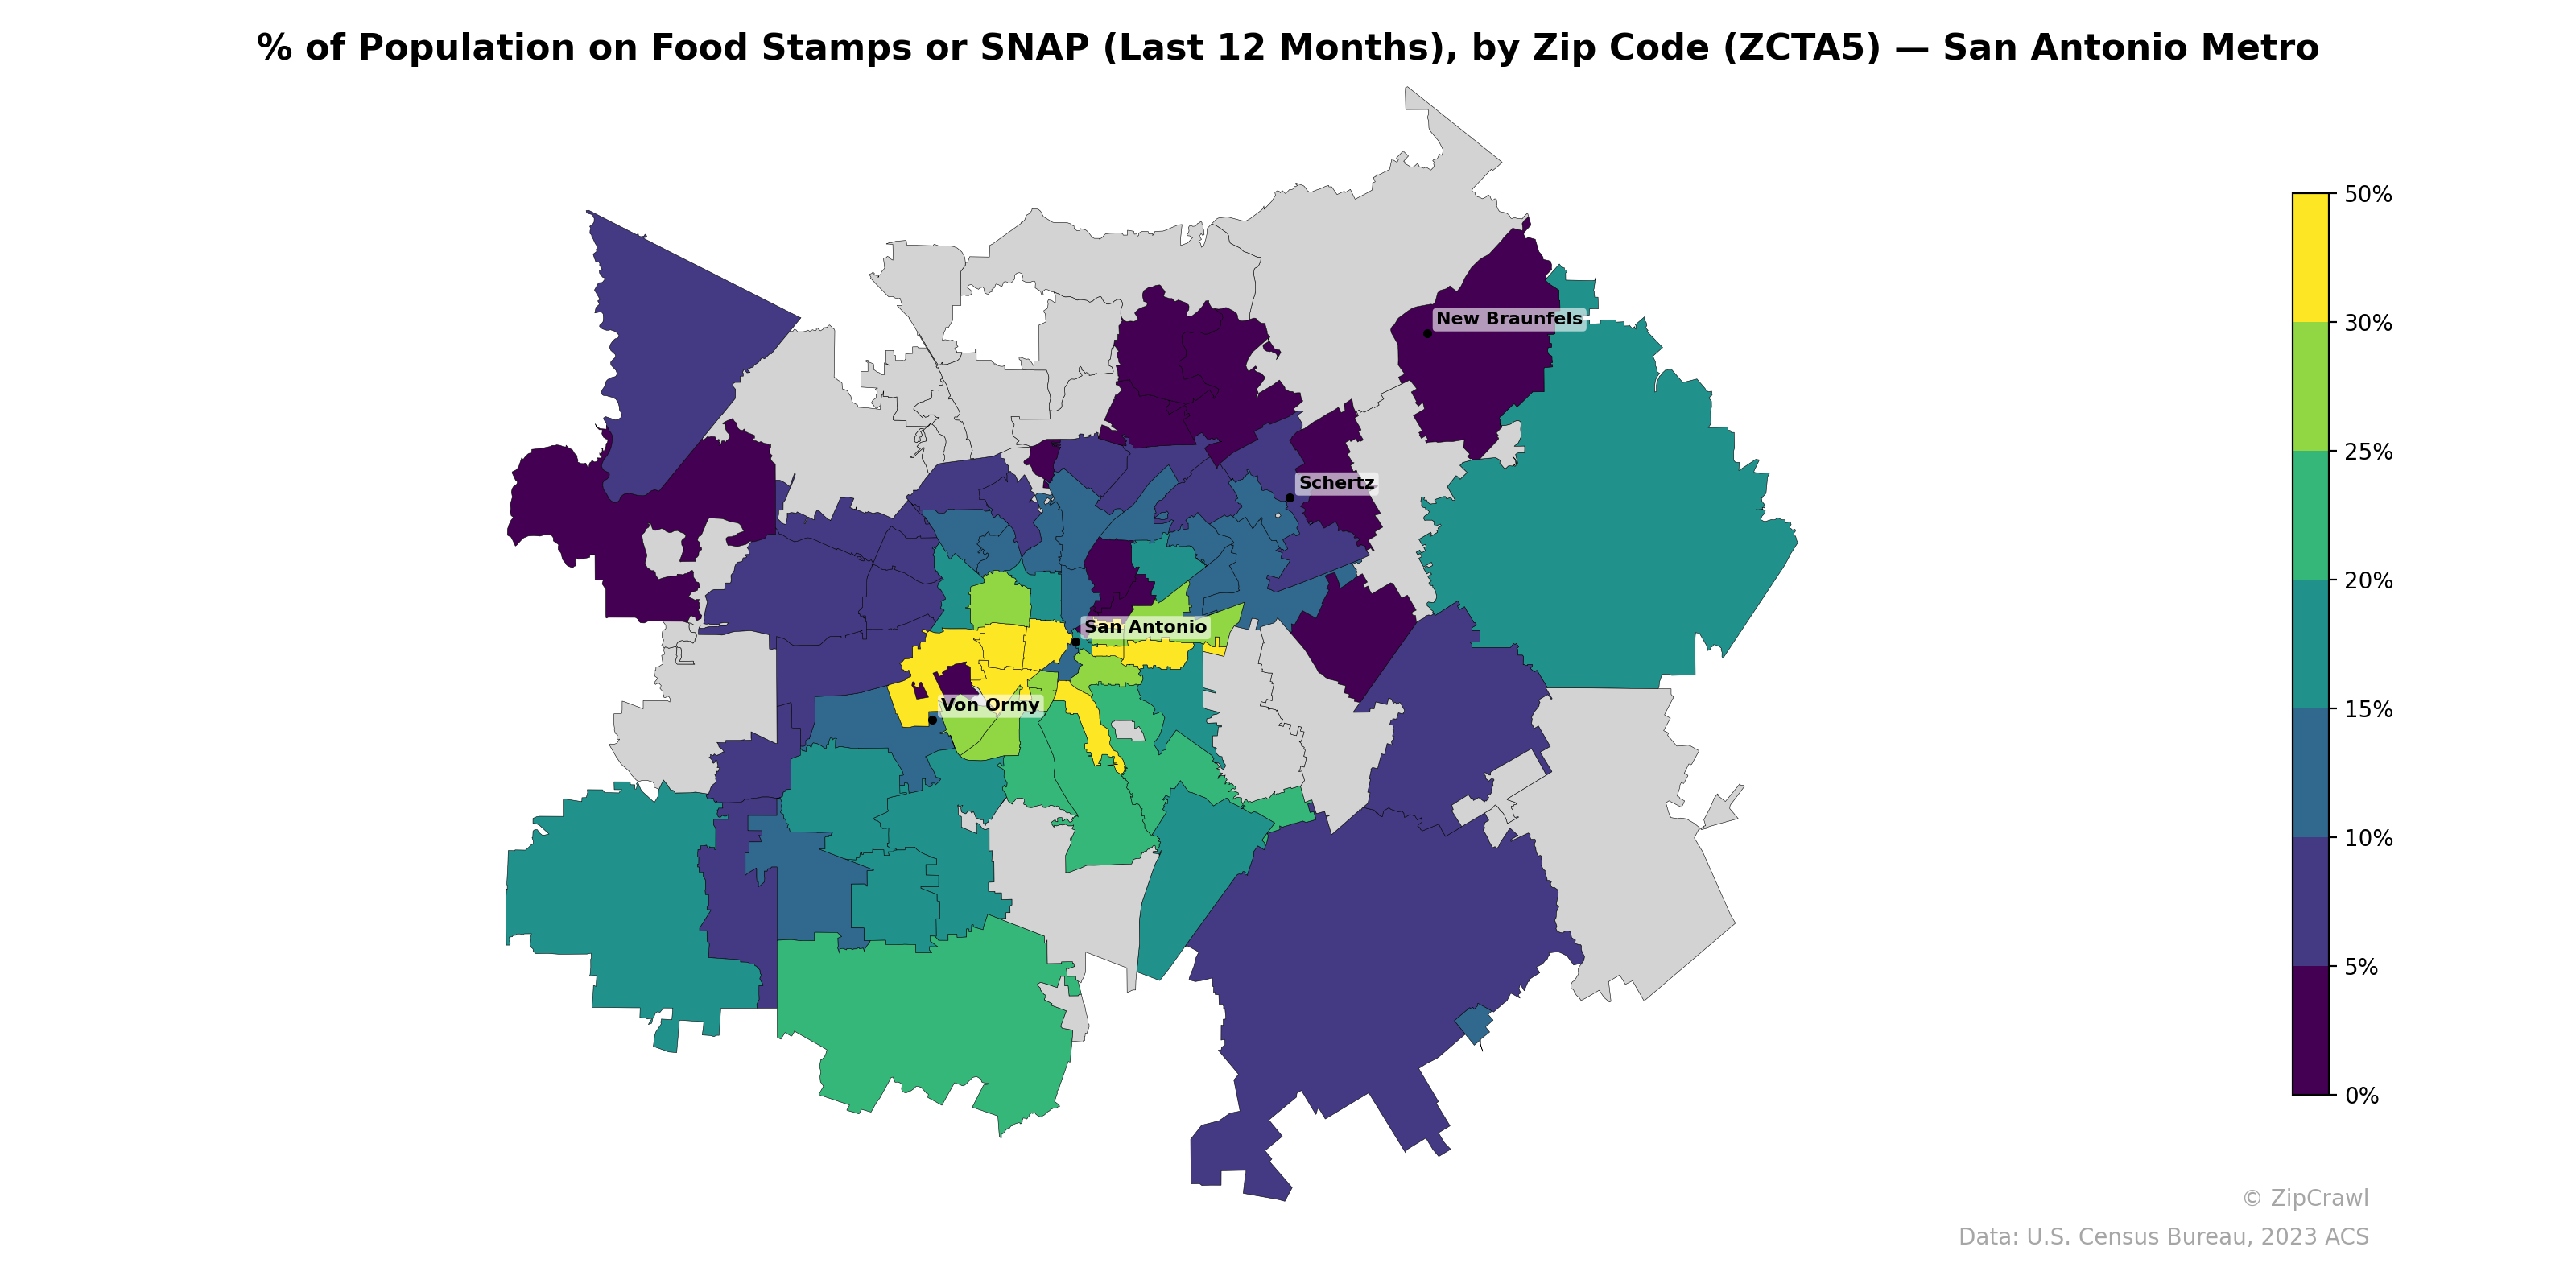
NOTE: Gray indicates insufficient data or a suppressed estimate.
The highest SNAP participation rates, exceeding 40–50%, concentrate in a tight cluster of zip codes immediately surrounding downtown San Antonio and the Von Ormy area to the southwest, forming a clear core of economic need. Outer suburban and exurban zip codes to the northeast near New Braunfels and Schertz, as well as the far northwest, generally fall below 10–15%, reflecting the more affluent commuter communities ringing the metro. A notable band of moderate SNAP usage (15–25%) extends south and southeast of the urban core, suggesting a gradient of economic vulnerability that diminishes with distance from central San Antonio but persists more strongly along southern corridors than northern ones.
Data: U.S. Census Bureau, 2023 ACS
Explore
- Population Hispanic % by Zip Code (ZCTA5) — Texas
- Population Non-Hispanic American Indian % by Zip Code (ZCTA5) — Austin Metro
- Population Hispanic % by Zip Code (ZCTA5) — Austin Metro
- Median Age by Zip Code (ZCTA5) — Austin Metro
- Population Non-Hispanic White % by Zip Code (ZCTA5) — Austin Metro
- Household Median Income by Zip Code (ZCTA5) — Austin Metro
- Population Non-Hispanic Black % by Zip Code (ZCTA5) — Austin Metro
- U.S. Citizens (% of Population Over 18) by Zip Code (ZCTA5) — Austin Metro
- Population Non-Hispanic Asian % by Zip Code (ZCTA5) — San Antonio Metro
- High School Graduate (% of Over 25) by Zip Code (ZCTA5) — Austin Metro
- High School Graduate (% of Over 25) by County
- Population Non-Hispanic White % by Zip Code (ZCTA5) — Texas
- U.S. Citizens (% of Population Over 18) by Zip Code (ZCTA5) — Texas
- Population Non-Hispanic Asian % by Zip Code (ZCTA5) — Chicago Metro
- Household Median Income by Zip Code (ZCTA5) — Texas
- Population Non-Hispanic Black % by Zip Code (ZCTA5) — Texas
- Population Non-Hispanic American Indian % by Zip Code (ZCTA5) — Texas
- Median Age by Zip Code (ZCTA5) — Texas
- High School Graduate (% of Over 25) by Zip Code (ZCTA5) — Texas
- Housing Owner-Occupied % of Units, by Zip Code (ZCTA5) — Baltimore Metro
- % of Population without Health Insurance, by Zip Code (ZCTA5) — Baltimore Metro
- Housing Owner-Occupied Median Value ($), by Zip Code (ZCTA5) — Baltimore Metro
- U.S. Citizens (% of Population Over 18) by Zip Code (ZCTA5) — Baltimore Metro
- High School Graduate (% of Over 25) by Zip Code (ZCTA5) — Baltimore Metro
- Population Non-Hispanic Asian % by Zip Code (ZCTA5) — Baltimore Metro
- Household Median Income by Zip Code (ZCTA5) — Baltimore Metro
- High School Graduate (% of Over 25) by Zip Code (ZCTA5) — Wisconsin
- % of Households with Broadband Internet, by Zip Code (ZCTA5) — Baltimore Metro
- Population Non-Hispanic American Indian % by Zip Code (ZCTA5) — Baltimore Metro
- Population Non-Hispanic Asian % by Zip Code (ZCTA5) — Charlotte Metro
- % of Population on Food Stamps or SNAP (Last 12 Months), by Zip Code (ZCTA5) — San Diego Metro
- % of Population on Food Stamps or SNAP (Last 12 Months), by Zip Code (ZCTA5) — Boston Metro
- % of Population on Food Stamps or SNAP (Last 12 Months), by Zip Code (ZCTA5) — Atlanta Metro
- % of Population on Food Stamps or SNAP (Last 12 Months), by Zip Code (ZCTA5) — Tampa Metro
- % of Population on Food Stamps or SNAP (Last 12 Months), by Zip Code (ZCTA5) — Austin Metro
- % of Population on Food Stamps or SNAP (Last 12 Months), by Zip Code (ZCTA5) — Houston Metro
- % of Population on Food Stamps or SNAP (Last 12 Months), by Zip Code (ZCTA5) — St. Louis Metro
- % of Population on Food Stamps or SNAP (Last 12 Months), by Zip Code (ZCTA5) — Miami Metro
- % of Population on Food Stamps or SNAP (Last 12 Months), by Zip Code (ZCTA5) — San Francisco Metro
- % of Population on Food Stamps or SNAP (Last 12 Months), by Zip Code (ZCTA5) — Orlando Metro