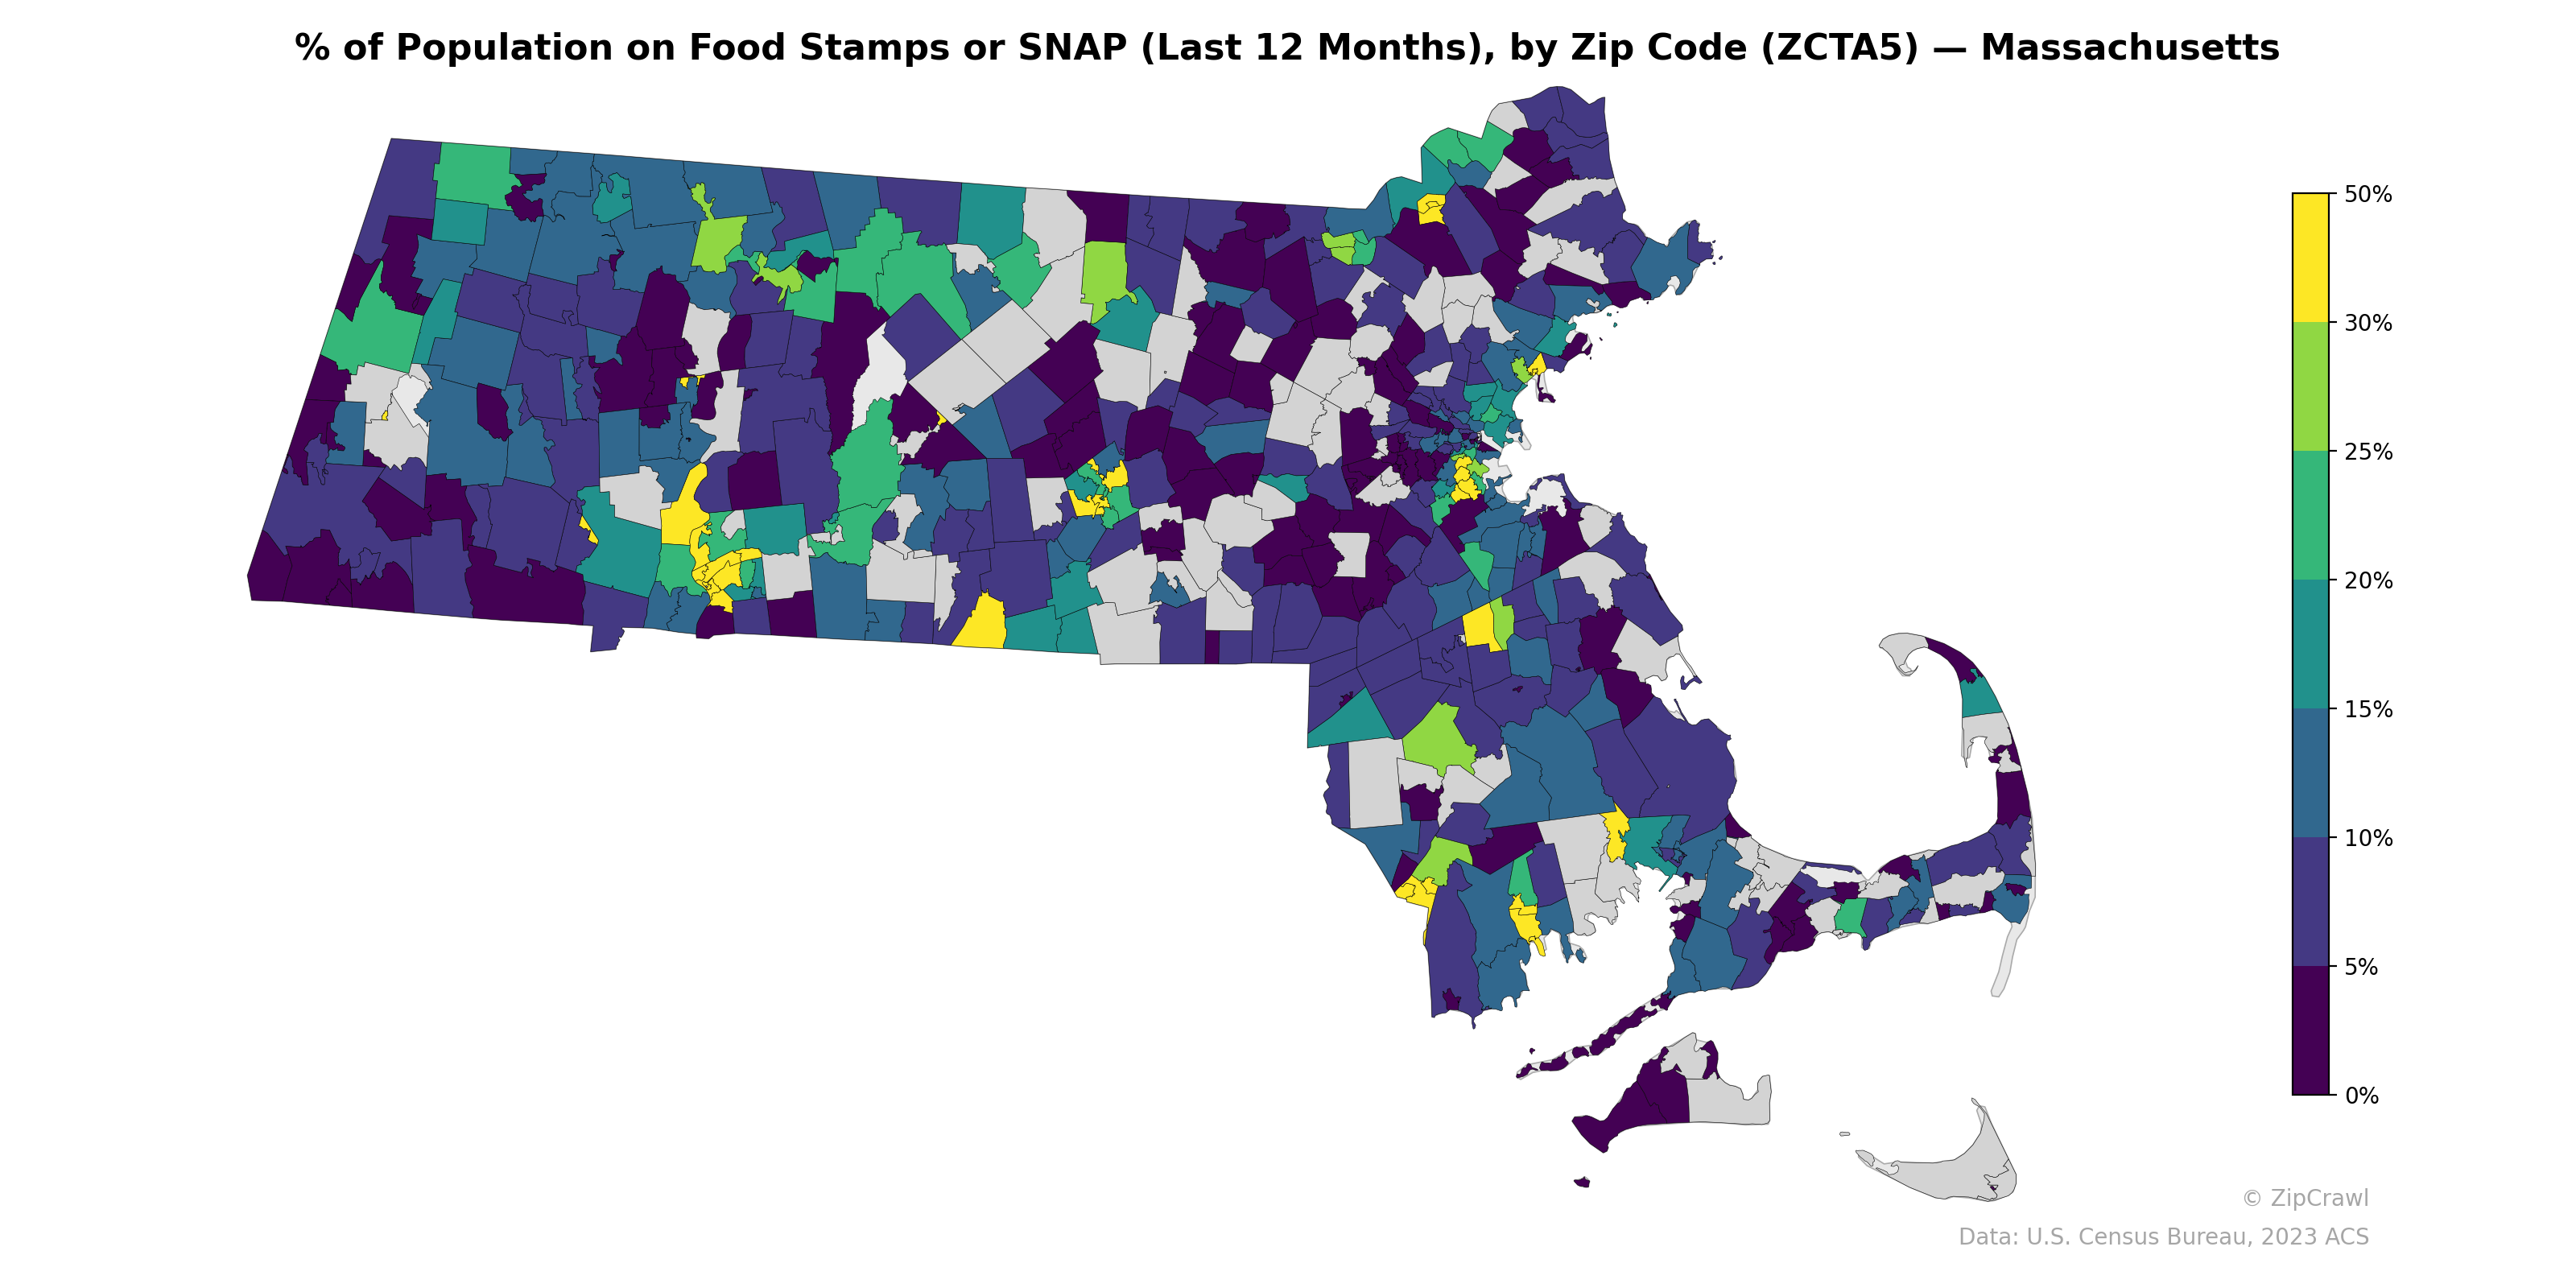
NOTE: Gray indicates insufficient data or a suppressed estimate.
Urban centers such as Springfield, Holyoke, and New Bedford stand out with SNAP participation rates exceeding 30–50%, forming distinct high-usage clusters in the western Pioneer Valley and southeastern coastal regions. In contrast, suburban zip codes west and south of Boston—particularly in the MetroWest corridor and along the South Shore—consistently register rates below 5%, reflecting sharp socioeconomic divides within relatively short distances. Cape Cod and the Islands display moderate variability, with pockets of elevated SNAP usage in lower Cape towns contrasting against wealthier enclaves on the outer Cape and Nantucket.
Data: U.S. Census Bureau, 2023 ACS
Explore
- Housing Owner-Occupied Median Value ($), by Zip Code (ZCTA5) — Los Angeles Metro
- Population Non-Hispanic Black % by Zip Code (ZCTA5) — Indiana
- Household Median Income by Zip Code (ZCTA5) — Indiana
- Population Hispanic % by Zip Code (ZCTA5) — Indiana
- Population Non-Hispanic Asian % by Zip Code (ZCTA5) — Massachusetts
- Population Non-Hispanic White % by Zip Code (ZCTA5) — Indiana
- Population Non-Hispanic American Indian % by Zip Code (ZCTA5) — Indiana
- High School Graduate (% of Over 25) by Zip Code (ZCTA5) — Indiana
- U.S. Citizens (% of Population Over 18) by Zip Code (ZCTA5) — Indiana
- Median Age by Zip Code (ZCTA5) — Indiana
- High School Graduate (% of Over 25) by Zip Code (ZCTA5) — South Dakota
- Population Non-Hispanic Black % by County
- Housing Vacancy Rate by Zip Code (ZCTA5) — Los Angeles Metro
- Household Average Size by Zip Code (ZCTA5) — Los Angeles Metro
- Married Couple (% of all Households) by Zip Code (ZCTA5) — Los Angeles Metro
- Housing Owner-Occupied % of Units, by Zip Code (ZCTA5) — Los Angeles Metro
- Housing Median Monthly Rent ($), by Zip Code (ZCTA5) — Los Angeles Metro
- % of Households with Broadband Internet, by Zip Code (ZCTA5) — Los Angeles Metro
- Bachelor's Degree or Higher (% of Over 25) by Zip Code (ZCTA5) — Los Angeles Metro
- % of Population without Health Insurance, by Zip Code (ZCTA5) — Los Angeles Metro
- Housing % of Units Built Since 2010, by Zip Code (ZCTA5) — Los Angeles Metro
- Housing % of Units Built Since 2010, by Zip Code (ZCTA5) — Tennessee
- Housing Owner-Occupied Median Value ($), by Zip Code (ZCTA5) — Tennessee
- Household Average Size by Zip Code (ZCTA5) — Tennessee
- High School Graduate (% of Over 25) by Zip Code (ZCTA5) — Tennessee
- Population Non-Hispanic American Indian % by Zip Code (ZCTA5) — Tennessee
- % of Population without Health Insurance, by Zip Code (ZCTA5) — Tennessee
- Housing Owner-Occupied % of Units, by Zip Code (ZCTA5) — Tennessee
- Housing Median Monthly Rent ($), by Zip Code (ZCTA5) — Tennessee
- Bachelor's Degree or Higher (% of Over 25) by Zip Code (ZCTA5) — Tennessee
- % of Population on Food Stamps or SNAP (Last 12 Months), by Zip Code (ZCTA5) — Maine
- % of Population on Food Stamps or SNAP (Last 12 Months), by Zip Code (ZCTA5) — Ohio
- % of Population on Food Stamps or SNAP (Last 12 Months), by Zip Code (ZCTA5) — Montana
- % of Population on Food Stamps or SNAP (Last 12 Months), by Zip Code (ZCTA5) — Oregon
- % of Population on Food Stamps or SNAP (Last 12 Months), by Zip Code (ZCTA5) — Iowa
- % of Population on Food Stamps or SNAP (Last 12 Months), by Zip Code (ZCTA5) — Utah
- % of Population on Food Stamps or SNAP (Last 12 Months), by Zip Code (ZCTA5) — Maryland
- % of Population on Food Stamps or SNAP (Last 12 Months), by Zip Code (ZCTA5) — Idaho
- % of Population on Food Stamps or SNAP (Last 12 Months), by Zip Code (ZCTA5) — Texas
- % of Population on Food Stamps or SNAP (Last 12 Months), by Zip Code (ZCTA5) — Alaska