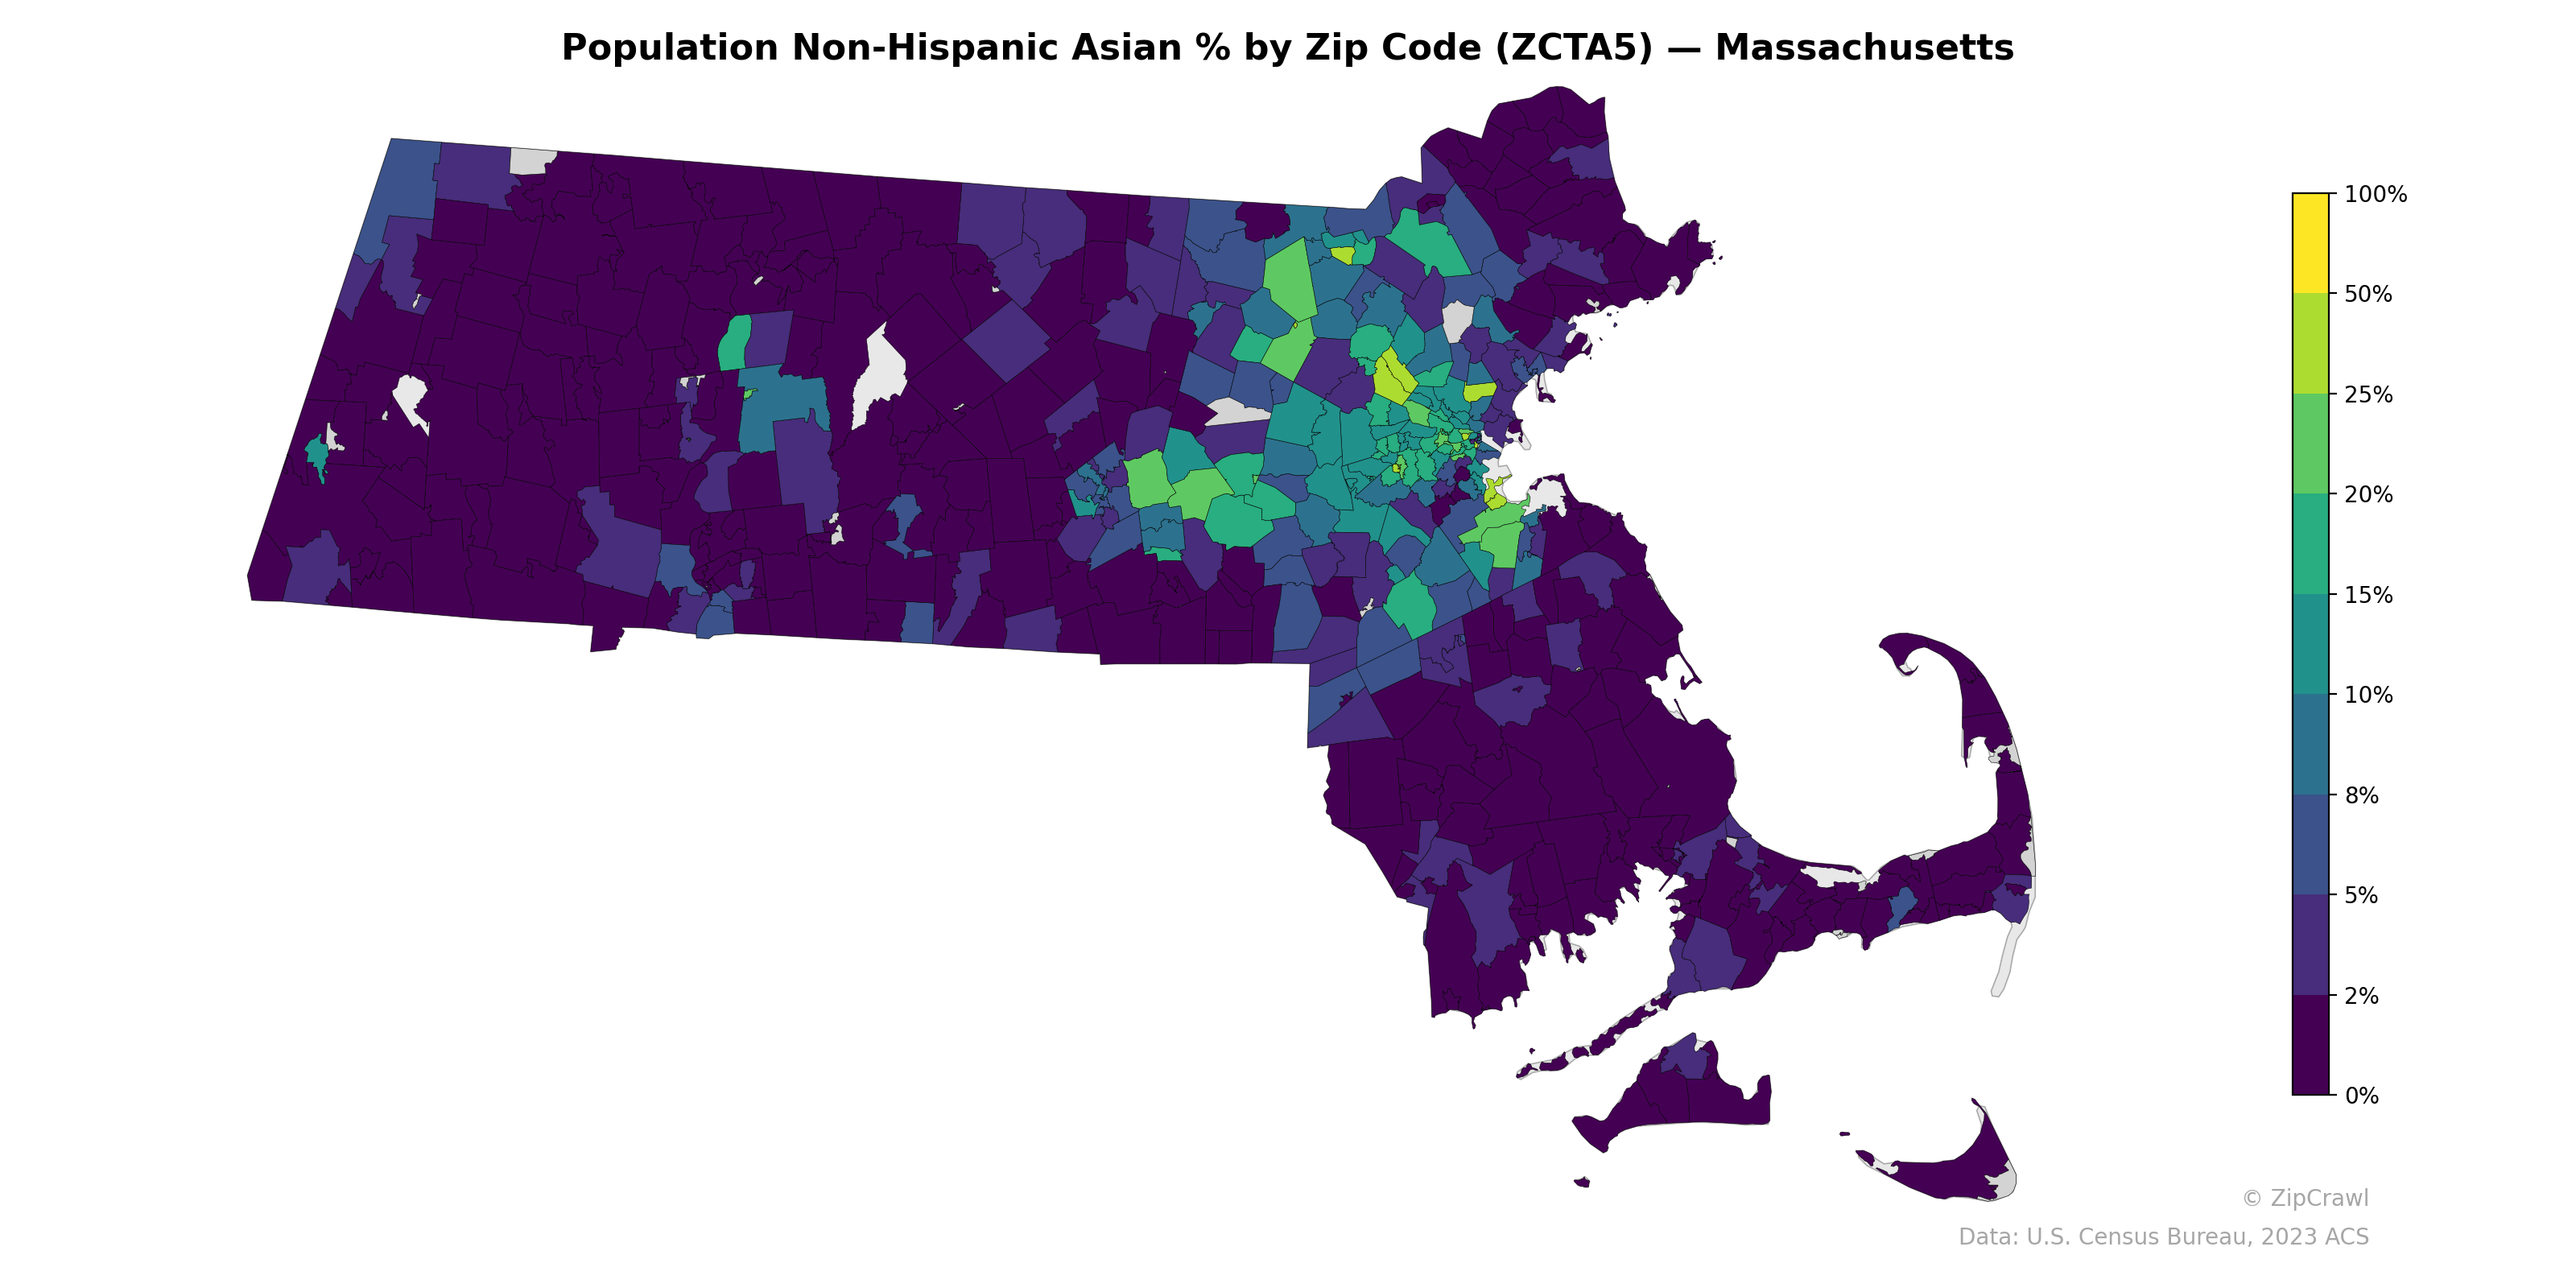
NOTE: Gray indicates insufficient data or a suppressed estimate.
The highest concentrations of Non-Hispanic Asian residents cluster heavily in the Greater Boston metro area, particularly in zip codes spanning the Route 128/I-95 corridor through communities like Lexington, Burlington, and Quincy, where several zip codes exceed 25–50%. Western Massachusetts, Cape Cod, and the southeastern portions of the state consistently register below 2–5%, creating a stark east-west demographic divide. A few isolated pockets of moderate Asian population percentages appear in the Pioneer Valley near Amherst and Northampton, likely influenced by the Five College consortium institutions.
Data: U.S. Census Bureau, 2023 ACS
Explore
- Housing Owner-Occupied Median Value ($), by Zip Code (ZCTA5) — Los Angeles Metro
- Population Hispanic % by Zip Code (ZCTA5) — Indiana
- U.S. Citizens (% of Population Over 18) by Zip Code (ZCTA5) — Indiana
- Population Non-Hispanic Black % by Zip Code (ZCTA5) — Indiana
- Median Age by Zip Code (ZCTA5) — Indiana
- Population Non-Hispanic White % by Zip Code (ZCTA5) — Indiana
- Population Non-Hispanic American Indian % by Zip Code (ZCTA5) — Indiana
- High School Graduate (% of Over 25) by Zip Code (ZCTA5) — Indiana
- % of Population on Food Stamps or SNAP (Last 12 Months), by Zip Code (ZCTA5) — Massachusetts
- Household Median Income by Zip Code (ZCTA5) — Indiana
- Population Non-Hispanic American Indian % by Zip Code (ZCTA5) — South Dakota
- Population Non-Hispanic Black % by County
- Married Couple (% of all Households) by Zip Code (ZCTA5) — Los Angeles Metro
- Housing % of Units Built Since 2010, by Zip Code (ZCTA5) — Los Angeles Metro
- Household Average Size by Zip Code (ZCTA5) — Los Angeles Metro
- Housing Owner-Occupied % of Units, by Zip Code (ZCTA5) — Los Angeles Metro
- % of Population without Health Insurance, by Zip Code (ZCTA5) — Los Angeles Metro
- Bachelor's Degree or Higher (% of Over 25) by Zip Code (ZCTA5) — Los Angeles Metro
- % of Population on Food Stamps or SNAP (Last 12 Months), by Zip Code (ZCTA5) — New York Metro
- % of Households with Broadband Internet, by Zip Code (ZCTA5) — Los Angeles Metro
- Housing Median Monthly Rent ($), by Zip Code (ZCTA5) — Los Angeles Metro
- Housing Vacancy Rate by Zip Code (ZCTA5) — Los Angeles Metro
- Housing Median Monthly Rent ($), by Zip Code (ZCTA5) — Tennessee
- Housing Owner-Occupied % of Units, by Zip Code (ZCTA5) — Tennessee
- Housing % of Units Built Since 2010, by Zip Code (ZCTA5) — Tennessee
- Population Non-Hispanic American Indian % by Zip Code (ZCTA5) — Tennessee
- % of Households with Broadband Internet, by Zip Code (ZCTA5) — Tennessee
- % of Population without Health Insurance, by Zip Code (ZCTA5) — Tennessee
- Housing Owner-Occupied Median Value ($), by Zip Code (ZCTA5) — Tennessee
- Population Non-Hispanic Black % by Zip Code (ZCTA5) — Tennessee
- Population Non-Hispanic Asian % by Zip Code (ZCTA5) — Maine
- Population Non-Hispanic Asian % by Zip Code (ZCTA5) — Maryland
- Population Non-Hispanic Asian % by Zip Code (ZCTA5) — Ohio
- Population Non-Hispanic Asian % by Zip Code (ZCTA5) — Utah
- Population Non-Hispanic Asian % by Zip Code (ZCTA5) — Iowa
- Population Non-Hispanic Asian % by Zip Code (ZCTA5) — Michigan
- Population Non-Hispanic Asian % by Zip Code (ZCTA5) — Montana
- Population Non-Hispanic Asian % by Zip Code (ZCTA5) — Texas
- Population Non-Hispanic Asian % by Zip Code (ZCTA5) — Nevada
- Population Non-Hispanic Asian % by Zip Code (ZCTA5) — Oregon