NOTE: Gray indicates insufficient data or a suppressed estimate.
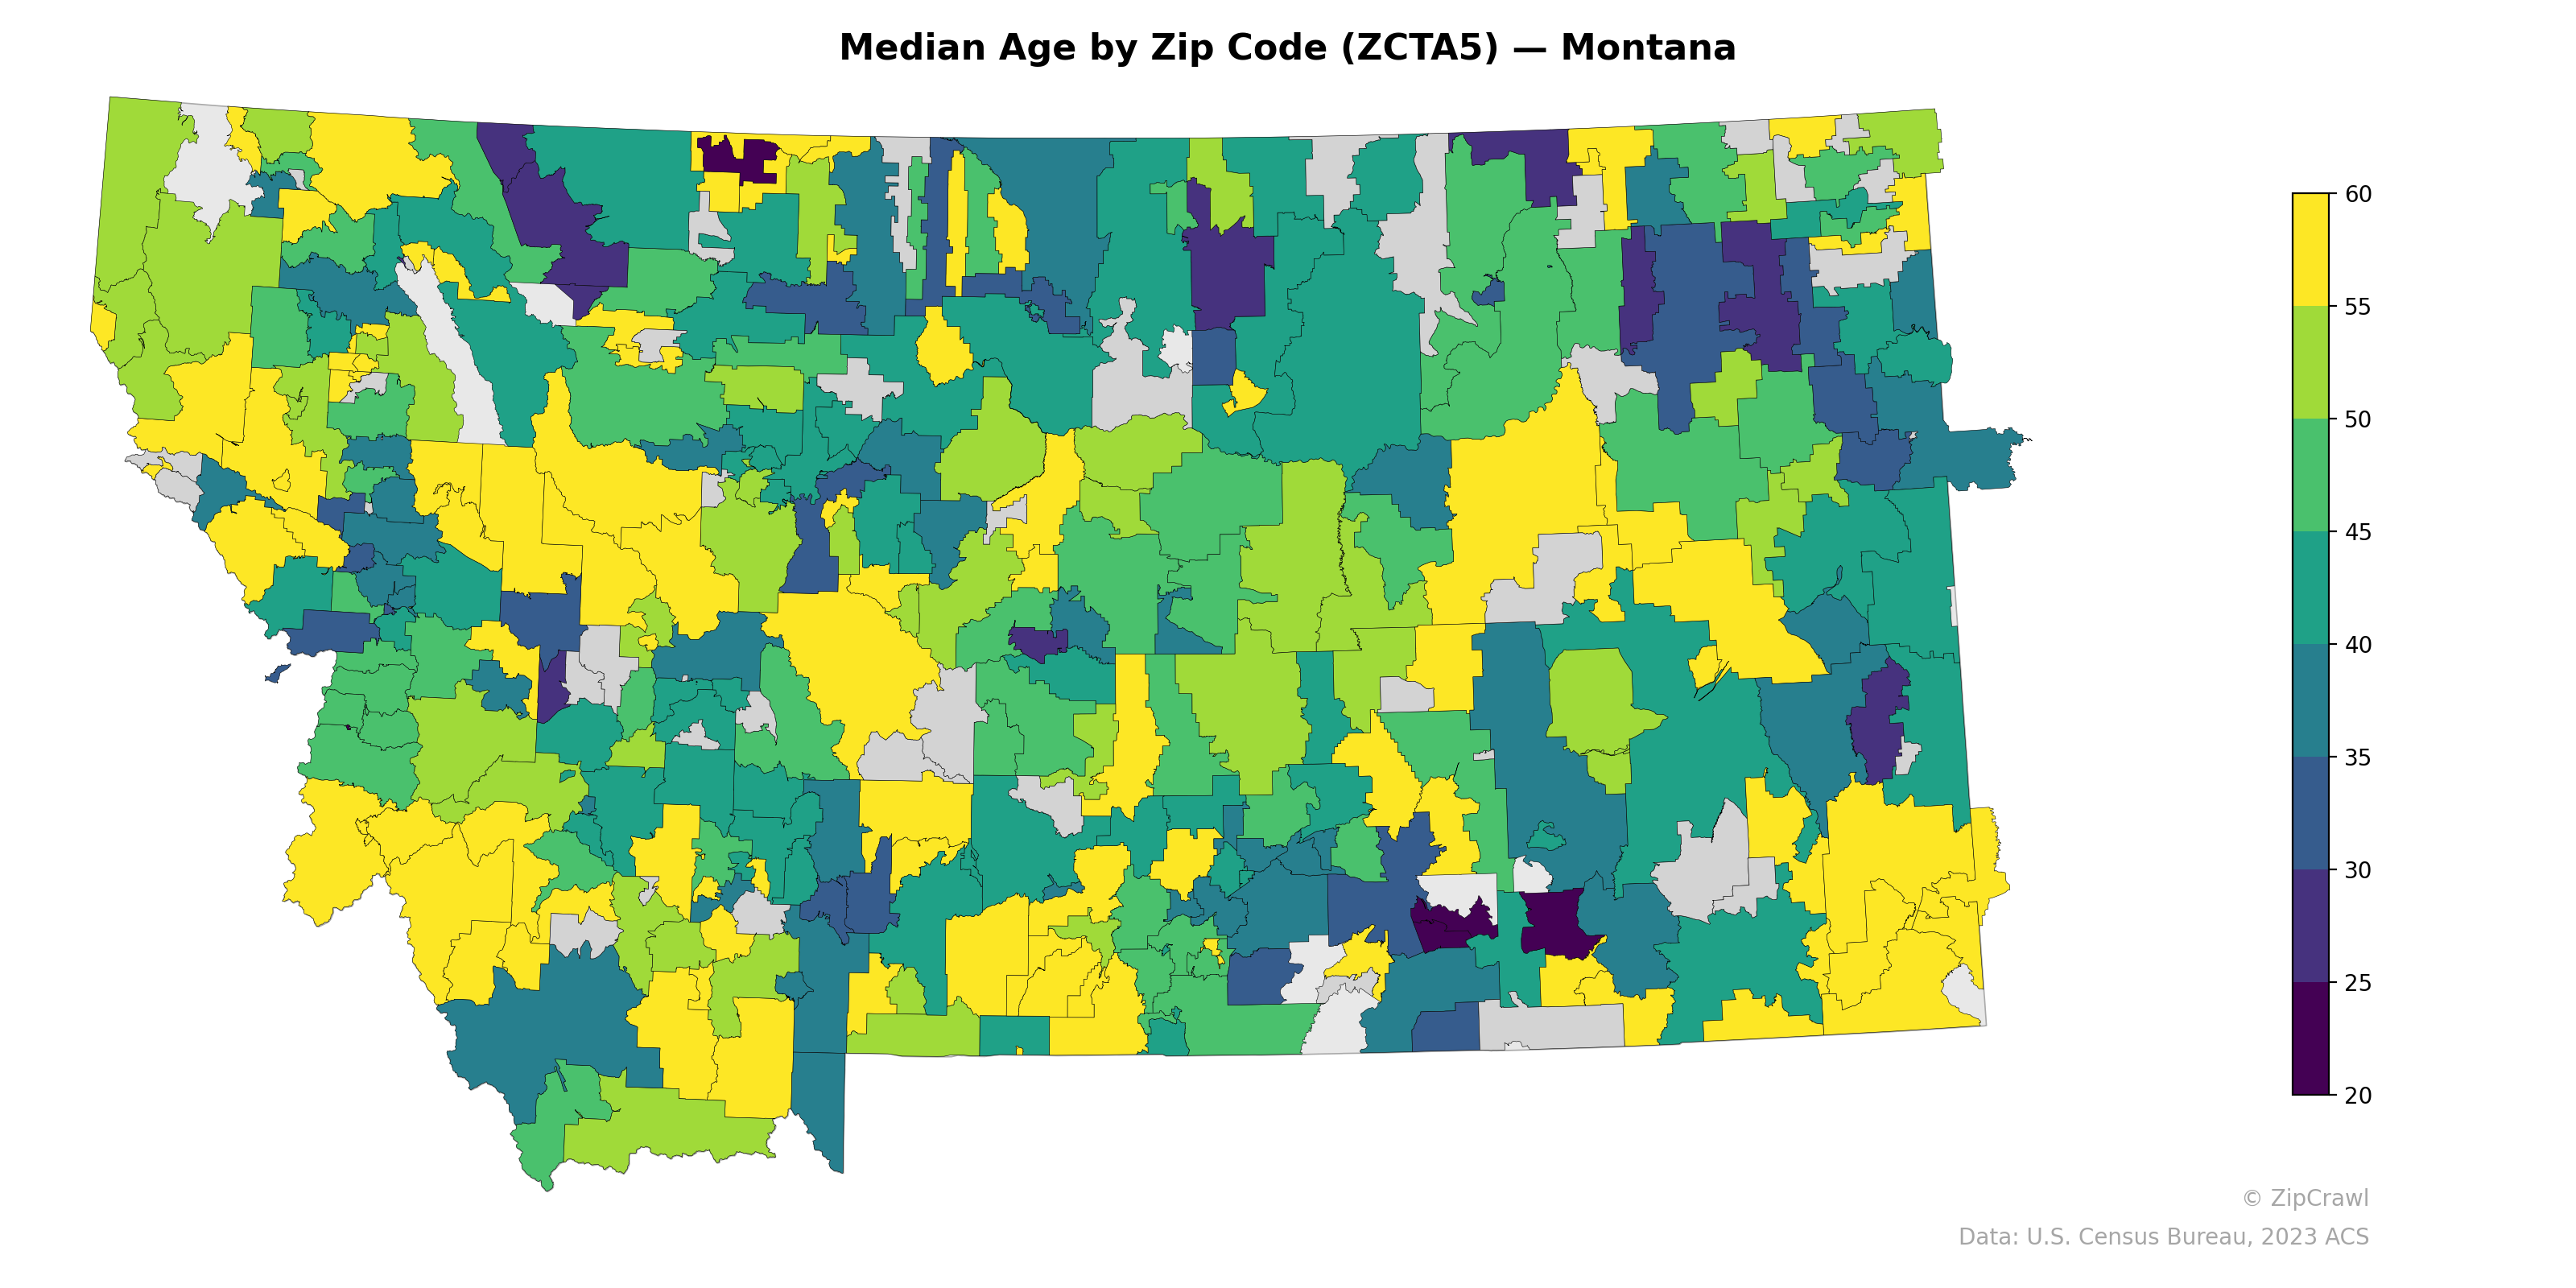
Montana's median age distribution reveals a striking contrast between the southwestern and south-central regions, where numerous zip codes cluster in the 50–60+ range (yellow), and the north-central and northeastern portions of the state, which trend younger with median ages in the 35–45 range (green/teal). Several zip codes near major population centers—particularly around Missoula, Bozeman, and Billings—display notably lower median ages in the 20–30 range (dark blue/purple), likely reflecting the influence of university student populations and younger urban demographics. The Crow and Northern Cheyenne reservation areas in the south-central region also stand out with distinctly younger median ages compared to surrounding rural zip codes, consistent with the younger age structures typical of Native American communities.
Data: U.S. Census Bureau, 2023 ACS
Explore
- Population Non-Hispanic Black % by Zip Code (ZCTA5) — New York
- Married Couple (% of all Households) by Zip Code (ZCTA5) — Maine
- Household Median Income by Zip Code (ZCTA5) — Montana
- Housing Vacancy Rate by Zip Code (ZCTA5) — Maine
- Population Non-Hispanic Black % by Zip Code (ZCTA5) — Montana
- Population Non-Hispanic Asian % by Zip Code (ZCTA5) — Maine
- % of Population on Food Stamps or SNAP (Last 12 Months), by Zip Code (ZCTA5) — Maine
- Population Hispanic % by Zip Code (ZCTA5) — Montana
- Population Non-Hispanic White % by Zip Code (ZCTA5) — Montana
- U.S. Citizens (% of Population Over 18) by Zip Code (ZCTA5) — Montana
- U.S. Citizens by County (% of Population Over 18)
- Housing % of Units Built Since 2010, by Zip Code (ZCTA5) — Illinois
- Housing % of Units Built Since 2010, by Zip Code (ZCTA5) — Washington
- Population Non-Hispanic American Indian % by Zip Code (ZCTA5) — New York
- High School Graduate (% of Over 25) by Zip Code (ZCTA5) — New York
- U.S. Citizens (% of Population Over 18) by Zip Code (ZCTA5) — New York
- Household Median Income by Zip Code (ZCTA5) — New York
- Population Non-Hispanic White % by Zip Code (ZCTA5) — New York
- % of Population on Food Stamps or SNAP (Last 12 Months), by Zip Code (ZCTA5) — Florida
- Population Hispanic % by Zip Code (ZCTA5) — New York
- Population Non-Hispanic Asian % by Zip Code (ZCTA5) — Florida
- Housing Vacancy Rate by Zip Code (ZCTA5) — West Virginia
- % of Households with Broadband Internet, by Zip Code (ZCTA5) — West Virginia
- Population Non-Hispanic Asian % by Zip Code (ZCTA5) — West Virginia
- Population Hispanic % by Zip Code (ZCTA5) — Hawaii
- % of Population without Health Insurance, by Zip Code (ZCTA5) — West Virginia
- High School Graduate (% of Over 25) by Zip Code (ZCTA5) — West Virginia
- Population Non-Hispanic American Indian % by Zip Code (ZCTA5) — West Virginia
- Bachelor's Degree or Higher (% of Over 25) by Zip Code (ZCTA5) — West Virginia
- % of Population on Food Stamps or SNAP (Last 12 Months), by Zip Code (ZCTA5) — West Virginia
- Median Age by Zip Code (ZCTA5) — Indiana
- Median Age by Zip Code (ZCTA5) — Vermont
- Median Age by Zip Code (ZCTA5) — Louisiana
- Median Age by Zip Code (ZCTA5) — Arizona
- Median Age by Zip Code (ZCTA5) — Maine
- Median Age by Zip Code (ZCTA5) — Utah
- Median Age by Zip Code (ZCTA5) — Ohio
- Median Age by Zip Code (ZCTA5) — Iowa
- Median Age by Zip Code (ZCTA5) — Texas
- Median Age by Zip Code (ZCTA5) — Idaho