NOTE: Gray indicates insufficient data or a suppressed estimate.
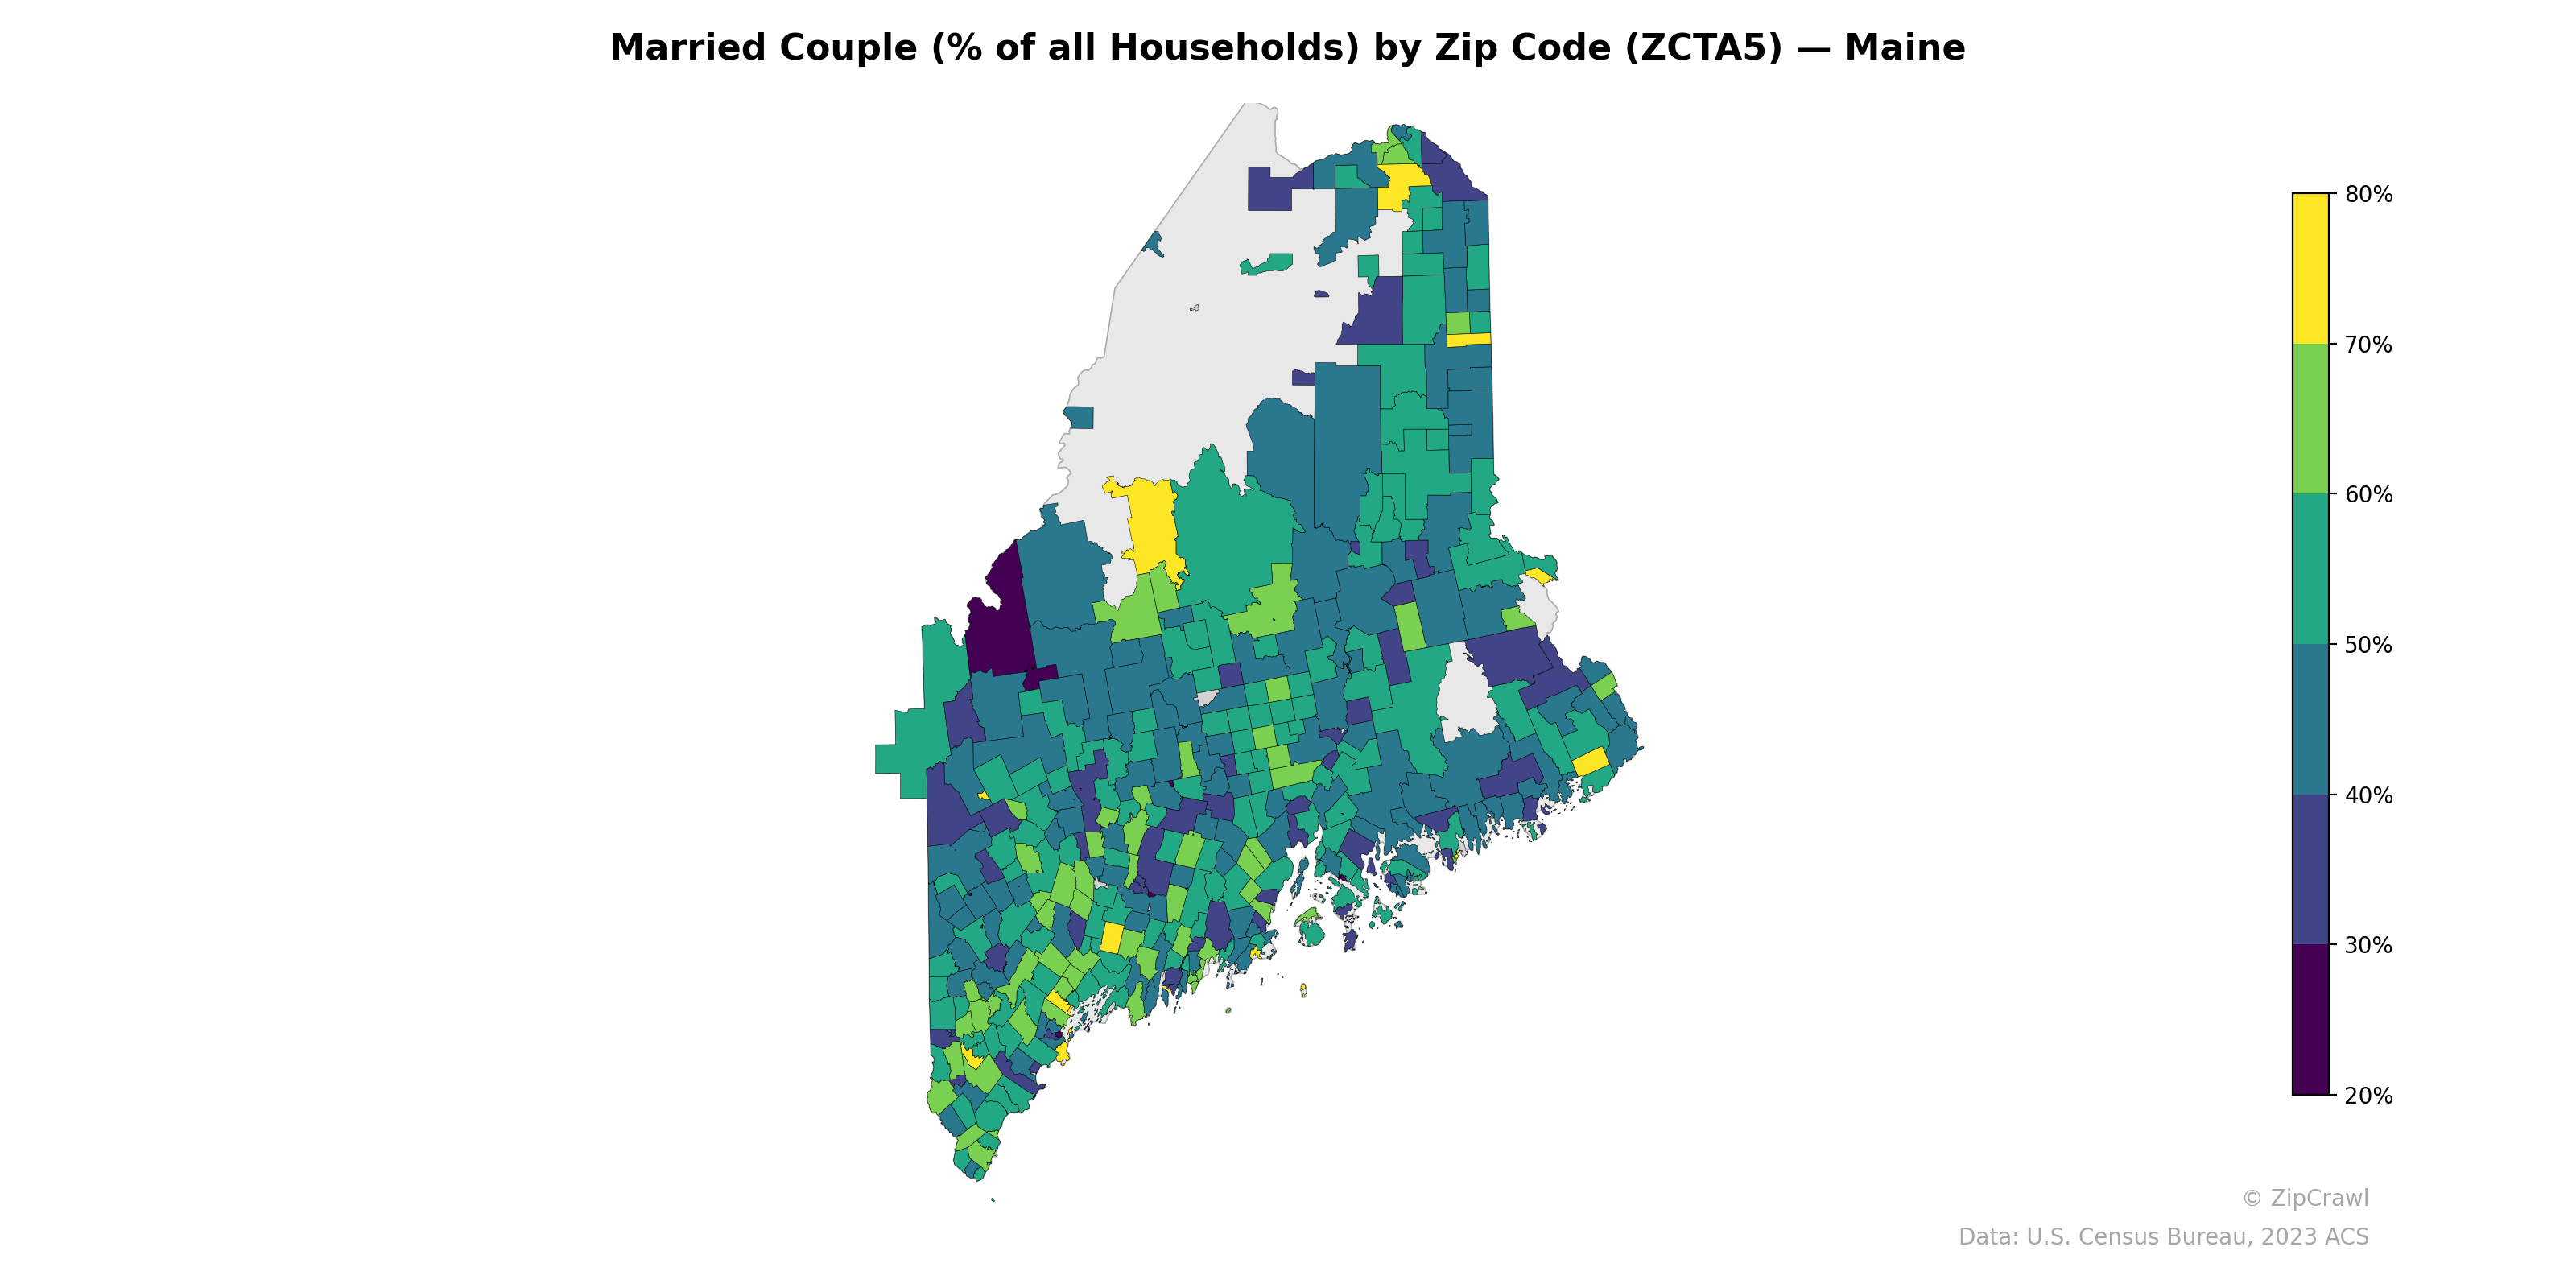
Married-couple household shares in Maine follow a clear urban-rural gradient, with the lowest concentrations (below 30%) clustered in southern coastal cities like Portland and in college towns such as Orono and Farmington, while rural interior and northern zip codes generally range from 50% to over 70%. The far northern Aroostook County region displays notable heterogeneity, with pockets of both high and low married-couple rates, contrasting with the more uniformly moderate values across the central highlands. Several small yellow-shaded zip codes scattered across the state—likely exurban or seasonal communities—reach married-couple shares near 80%, standing out sharply against adjacent areas.
Data: U.S. Census Bureau, 2023 ACS
Explore
- Population Non-Hispanic Black % by Zip Code (ZCTA5) — New York
- Population Non-Hispanic White % by Zip Code (ZCTA5) — Montana
- % of Population on Food Stamps or SNAP (Last 12 Months), by Zip Code (ZCTA5) — Maine
- Housing Vacancy Rate by Zip Code (ZCTA5) — Maine
- Population Hispanic % by Zip Code (ZCTA5) — Montana
- Population Non-Hispanic Black % by Zip Code (ZCTA5) — Montana
- Household Median Income by Zip Code (ZCTA5) — Montana
- U.S. Citizens (% of Population Over 18) by Zip Code (ZCTA5) — Montana
- Median Age by Zip Code (ZCTA5) — Montana
- Population Non-Hispanic Asian % by Zip Code (ZCTA5) — Maine
- U.S. Citizens by County (% of Population Over 18)
- High School Graduate (% of Over 25) by Zip Code (ZCTA5) — New York
- Bachelor's Degree or Higher (% of Over 25) by Zip Code (ZCTA5) — Illinois
- Population Non-Hispanic American Indian % by Zip Code (ZCTA5) — New York
- Median Age by Zip Code (ZCTA5) — New York
- U.S. Citizens (% of Population Over 18) by Zip Code (ZCTA5) — New York
- Population Non-Hispanic White % by Zip Code (ZCTA5) — New York
- Population Hispanic % by Zip Code (ZCTA5) — New York
- Population Non-Hispanic Asian % by Zip Code (ZCTA5) — Florida
- Bachelor's Degree or Higher (% of Over 25) by Zip Code (ZCTA5) — Washington
- % of Population on Food Stamps or SNAP (Last 12 Months), by Zip Code (ZCTA5) — Florida
- Household Median Income by Zip Code (ZCTA5) — New York
- % of Households with Broadband Internet, by Zip Code (ZCTA5) — West Virginia
- High School Graduate (% of Over 25) by Zip Code (ZCTA5) — West Virginia
- Population Non-Hispanic Asian % by Zip Code (ZCTA5) — West Virginia
- % of Population without Health Insurance, by Zip Code (ZCTA5) — West Virginia
- Household Average Size by Zip Code (ZCTA5) — West Virginia
- Population Non-Hispanic American Indian % by Zip Code (ZCTA5) — West Virginia
- Bachelor's Degree or Higher (% of Over 25) by Zip Code (ZCTA5) — West Virginia
- Population Hispanic % by Zip Code (ZCTA5) — Hawaii
- Married Couple (% of all Households) by Zip Code (ZCTA5) — Ohio
- Married Couple (% of all Households) by Zip Code (ZCTA5) — Iowa
- Married Couple (% of all Households) by Zip Code (ZCTA5) — Alaska
- Married Couple (% of all Households) by Zip Code (ZCTA5) — Utah
- Married Couple (% of all Households) by Zip Code (ZCTA5) — Texas
- Married Couple (% of all Households) by Zip Code (ZCTA5) — Alabama
- Married Couple (% of all Households) by Zip Code (ZCTA5) — Oregon
- Married Couple (% of all Households) by Zip Code (ZCTA5) — Maryland
- Married Couple (% of all Households) by Zip Code (ZCTA5) — Idaho
- Married Couple (% of all Households) by Zip Code (ZCTA5) — Hawaii