NOTE: Gray indicates insufficient data or a suppressed estimate.
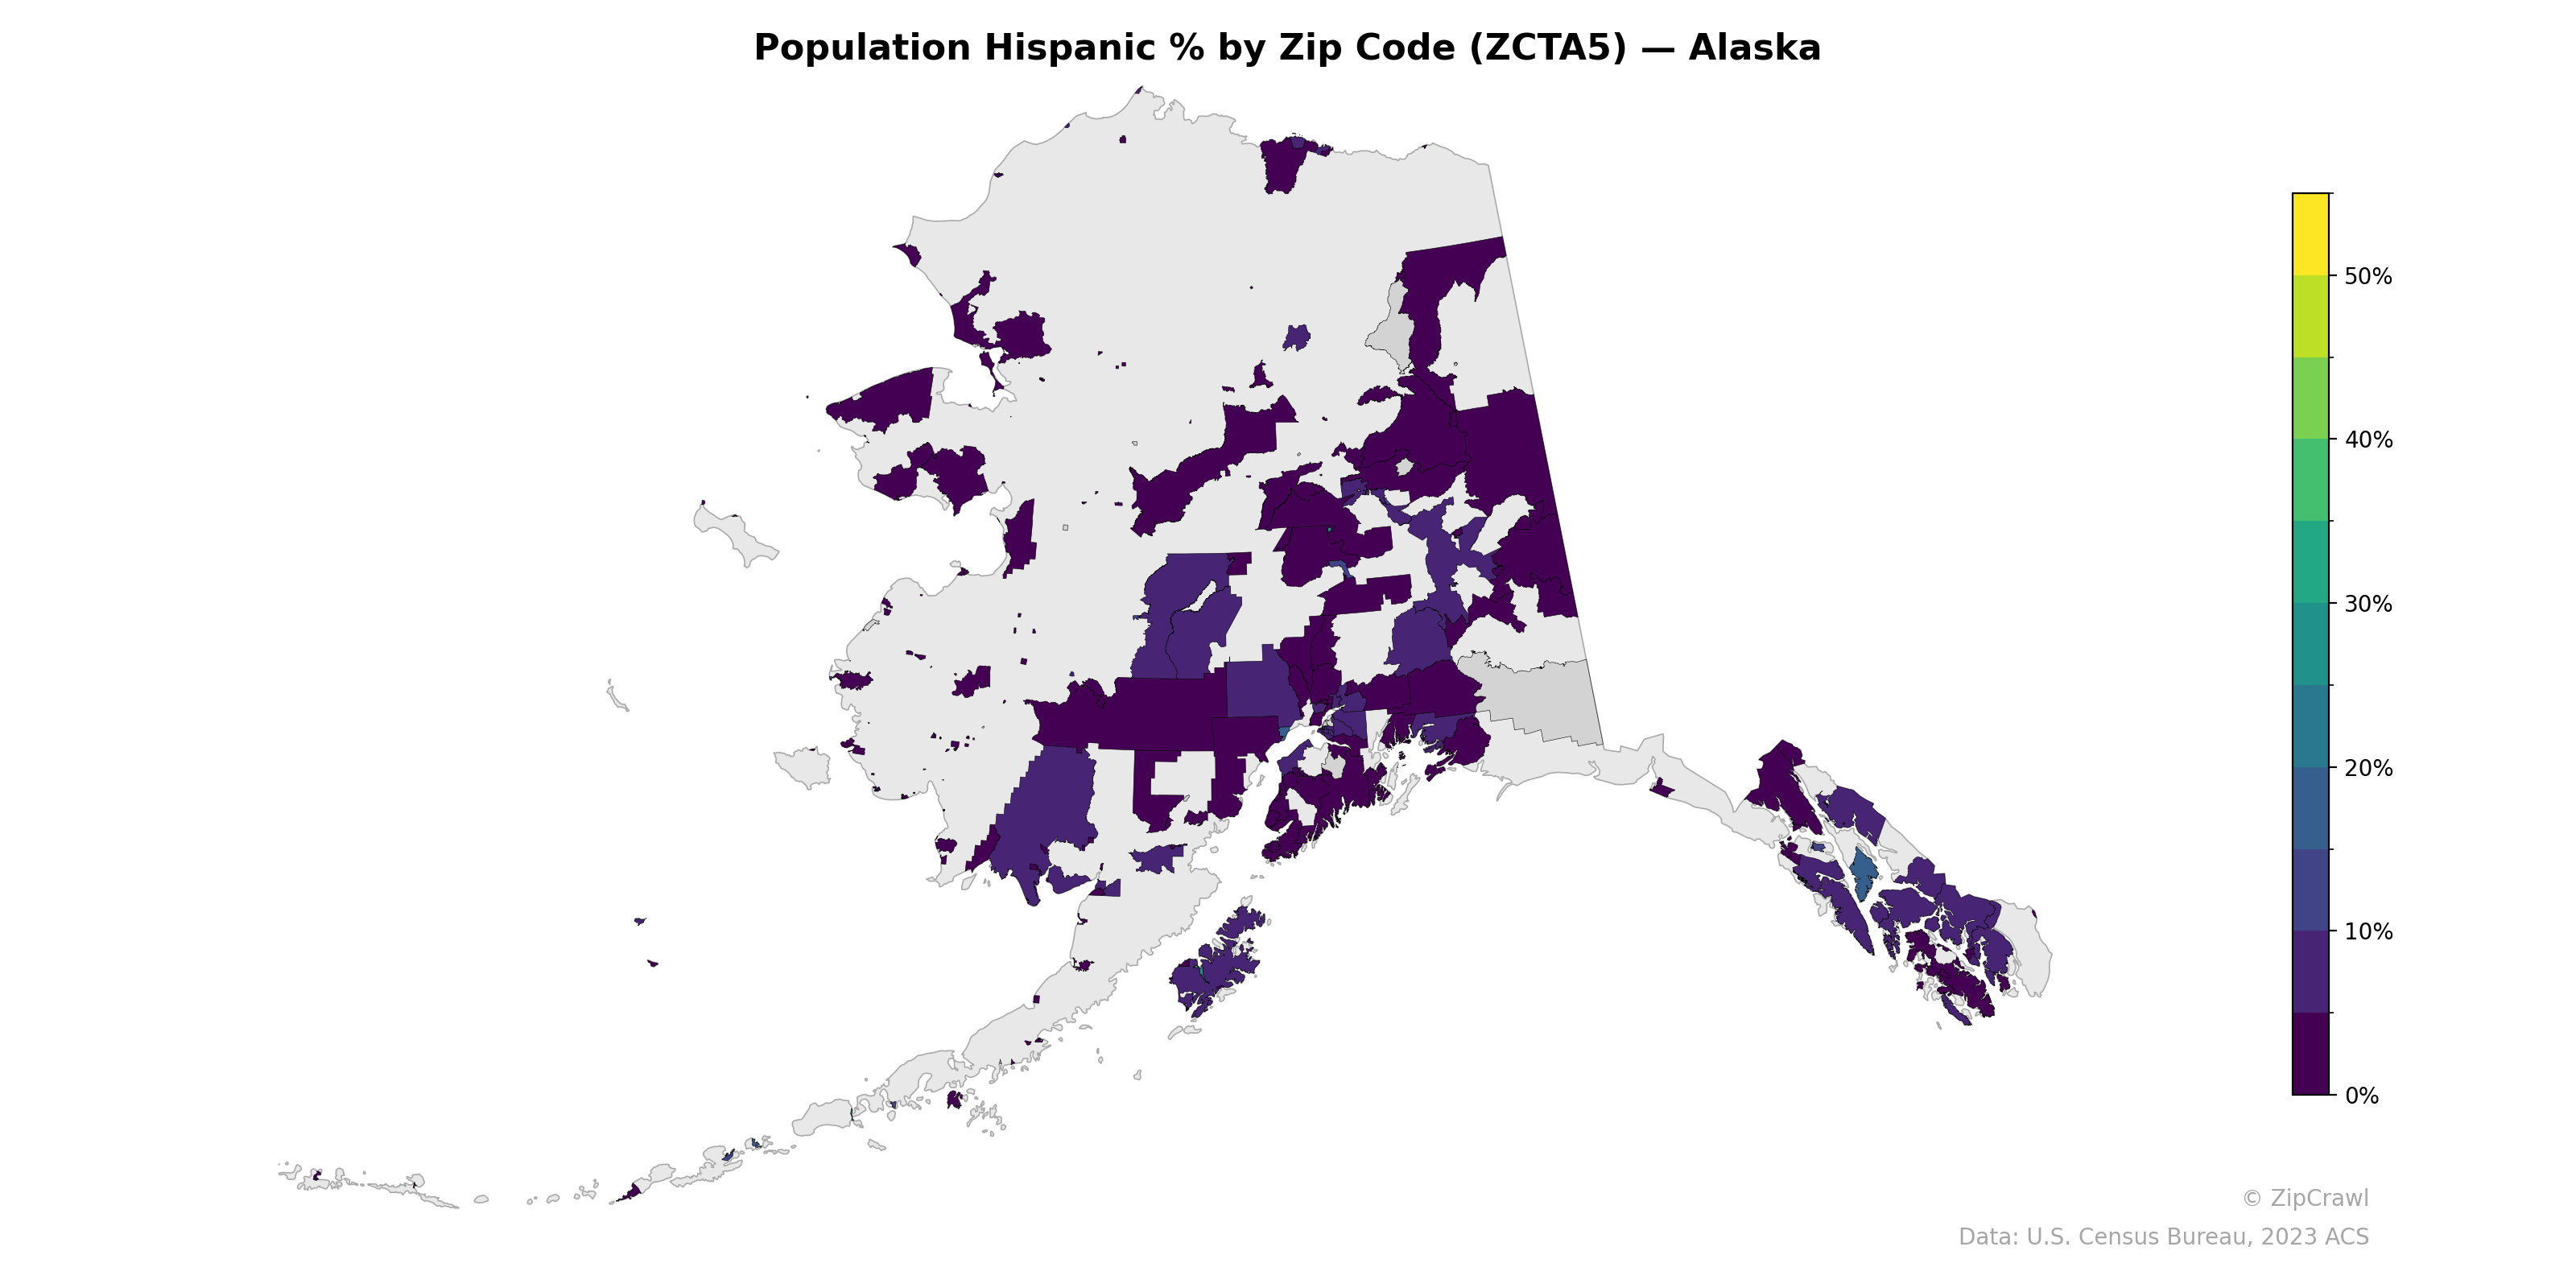
Hispanic population percentages across Alaska's zip codes are uniformly low, with the vast majority of areas falling below 10%, though a few scattered zip codes in the south-central region near Anchorage and the Kenai Peninsula exhibit moderately elevated concentrations approaching 10-15%. One notable outlier appears in the southeastern panhandle region, where a single zip code near Juneau displays a distinctly higher Hispanic percentage, reaching into the upper teens or low twenties based on its lighter coloring. The most remote northern and western zip codes, including areas along the Arctic coast and the Aleutian chain, consistently register among the lowest Hispanic population shares in the state.
Data: U.S. Census Bureau, 2023 ACS
Explore
- Household Average Size by Zip Code (ZCTA5) — New York
- Population Non-Hispanic Black % by Zip Code (ZCTA5) — Alaska
- U.S. Citizens (% of Population Over 18) by Zip Code (ZCTA5) — Alaska
- Population Non-Hispanic Asian % by Zip Code (ZCTA5) — North Dakota
- Population Non-Hispanic White % by Zip Code (ZCTA5) — Alaska
- Median Age by Zip Code (ZCTA5) — Alaska
- Household Median Income by Zip Code (ZCTA5) — Alaska
- % of Population on Food Stamps or SNAP (Last 12 Months), by Zip Code (ZCTA5) — North Dakota
- Married Couple (% of all Households) by Zip Code (ZCTA5) — North Dakota
- Housing Vacancy Rate by Zip Code (ZCTA5) — North Dakota
- Household Average Size by County
- Married Couple (% of all Households) by Zip Code (ZCTA5) — Illinois
- Married Couple (% of all Households) by Zip Code (ZCTA5) — New York
- Married Couple (% of all Households) by Zip Code (ZCTA5) — Missouri
- Housing Owner-Occupied Median Value ($), by Zip Code (ZCTA5) — New York
- % of Population without Health Insurance, by Zip Code (ZCTA5) — New York
- Housing Median Monthly Rent ($), by Zip Code (ZCTA5) — New York
- Housing Vacancy Rate by Zip Code (ZCTA5) — New York
- Bachelor's Degree or Higher (% of Over 25) by Zip Code (ZCTA5) — New York
- % of Households with Broadband Internet, by Zip Code (ZCTA5) — New York
- Housing % of Units Built Since 2010, by Zip Code (ZCTA5) — New York
- Housing Owner-Occupied % of Units, by Zip Code (ZCTA5) — New York
- Population Non-Hispanic American Indian % by Zip Code (ZCTA5) — North Dakota
- Population Non-Hispanic Black % by Zip Code (ZCTA5) — North Dakota
- Household Average Size by Zip Code (ZCTA5) — Rhode Island
- Population Non-Hispanic American Indian % by Zip Code (ZCTA5) — Rhode Island
- Housing Median Monthly Rent ($), by Zip Code (ZCTA5) — Rhode Island
- Population Non-Hispanic White % by Zip Code (ZCTA5) — Oregon
- Housing Vacancy Rate by Zip Code (ZCTA5) — Alaska
- Housing % of Units Built Since 2010, by Zip Code (ZCTA5) — Rhode Island
- Population Hispanic % by Zip Code (ZCTA5) — Alabama
- Population Hispanic % by Zip Code (ZCTA5) — Nebraska
- Population Hispanic % by Zip Code (ZCTA5) — Iowa
- Population Hispanic % by Zip Code (ZCTA5) — Utah
- Population Hispanic % by Zip Code (ZCTA5) — Ohio
- Population Hispanic % by Zip Code (ZCTA5) — Arizona
- Population Hispanic % by Zip Code (ZCTA5) — Texas
- Population Hispanic % by Zip Code (ZCTA5) — Oregon
- Population Hispanic % by Zip Code (ZCTA5) — Hawaii
- Population Hispanic % by Zip Code (ZCTA5) — Idaho