NOTE: Gray indicates insufficient data or a suppressed estimate.
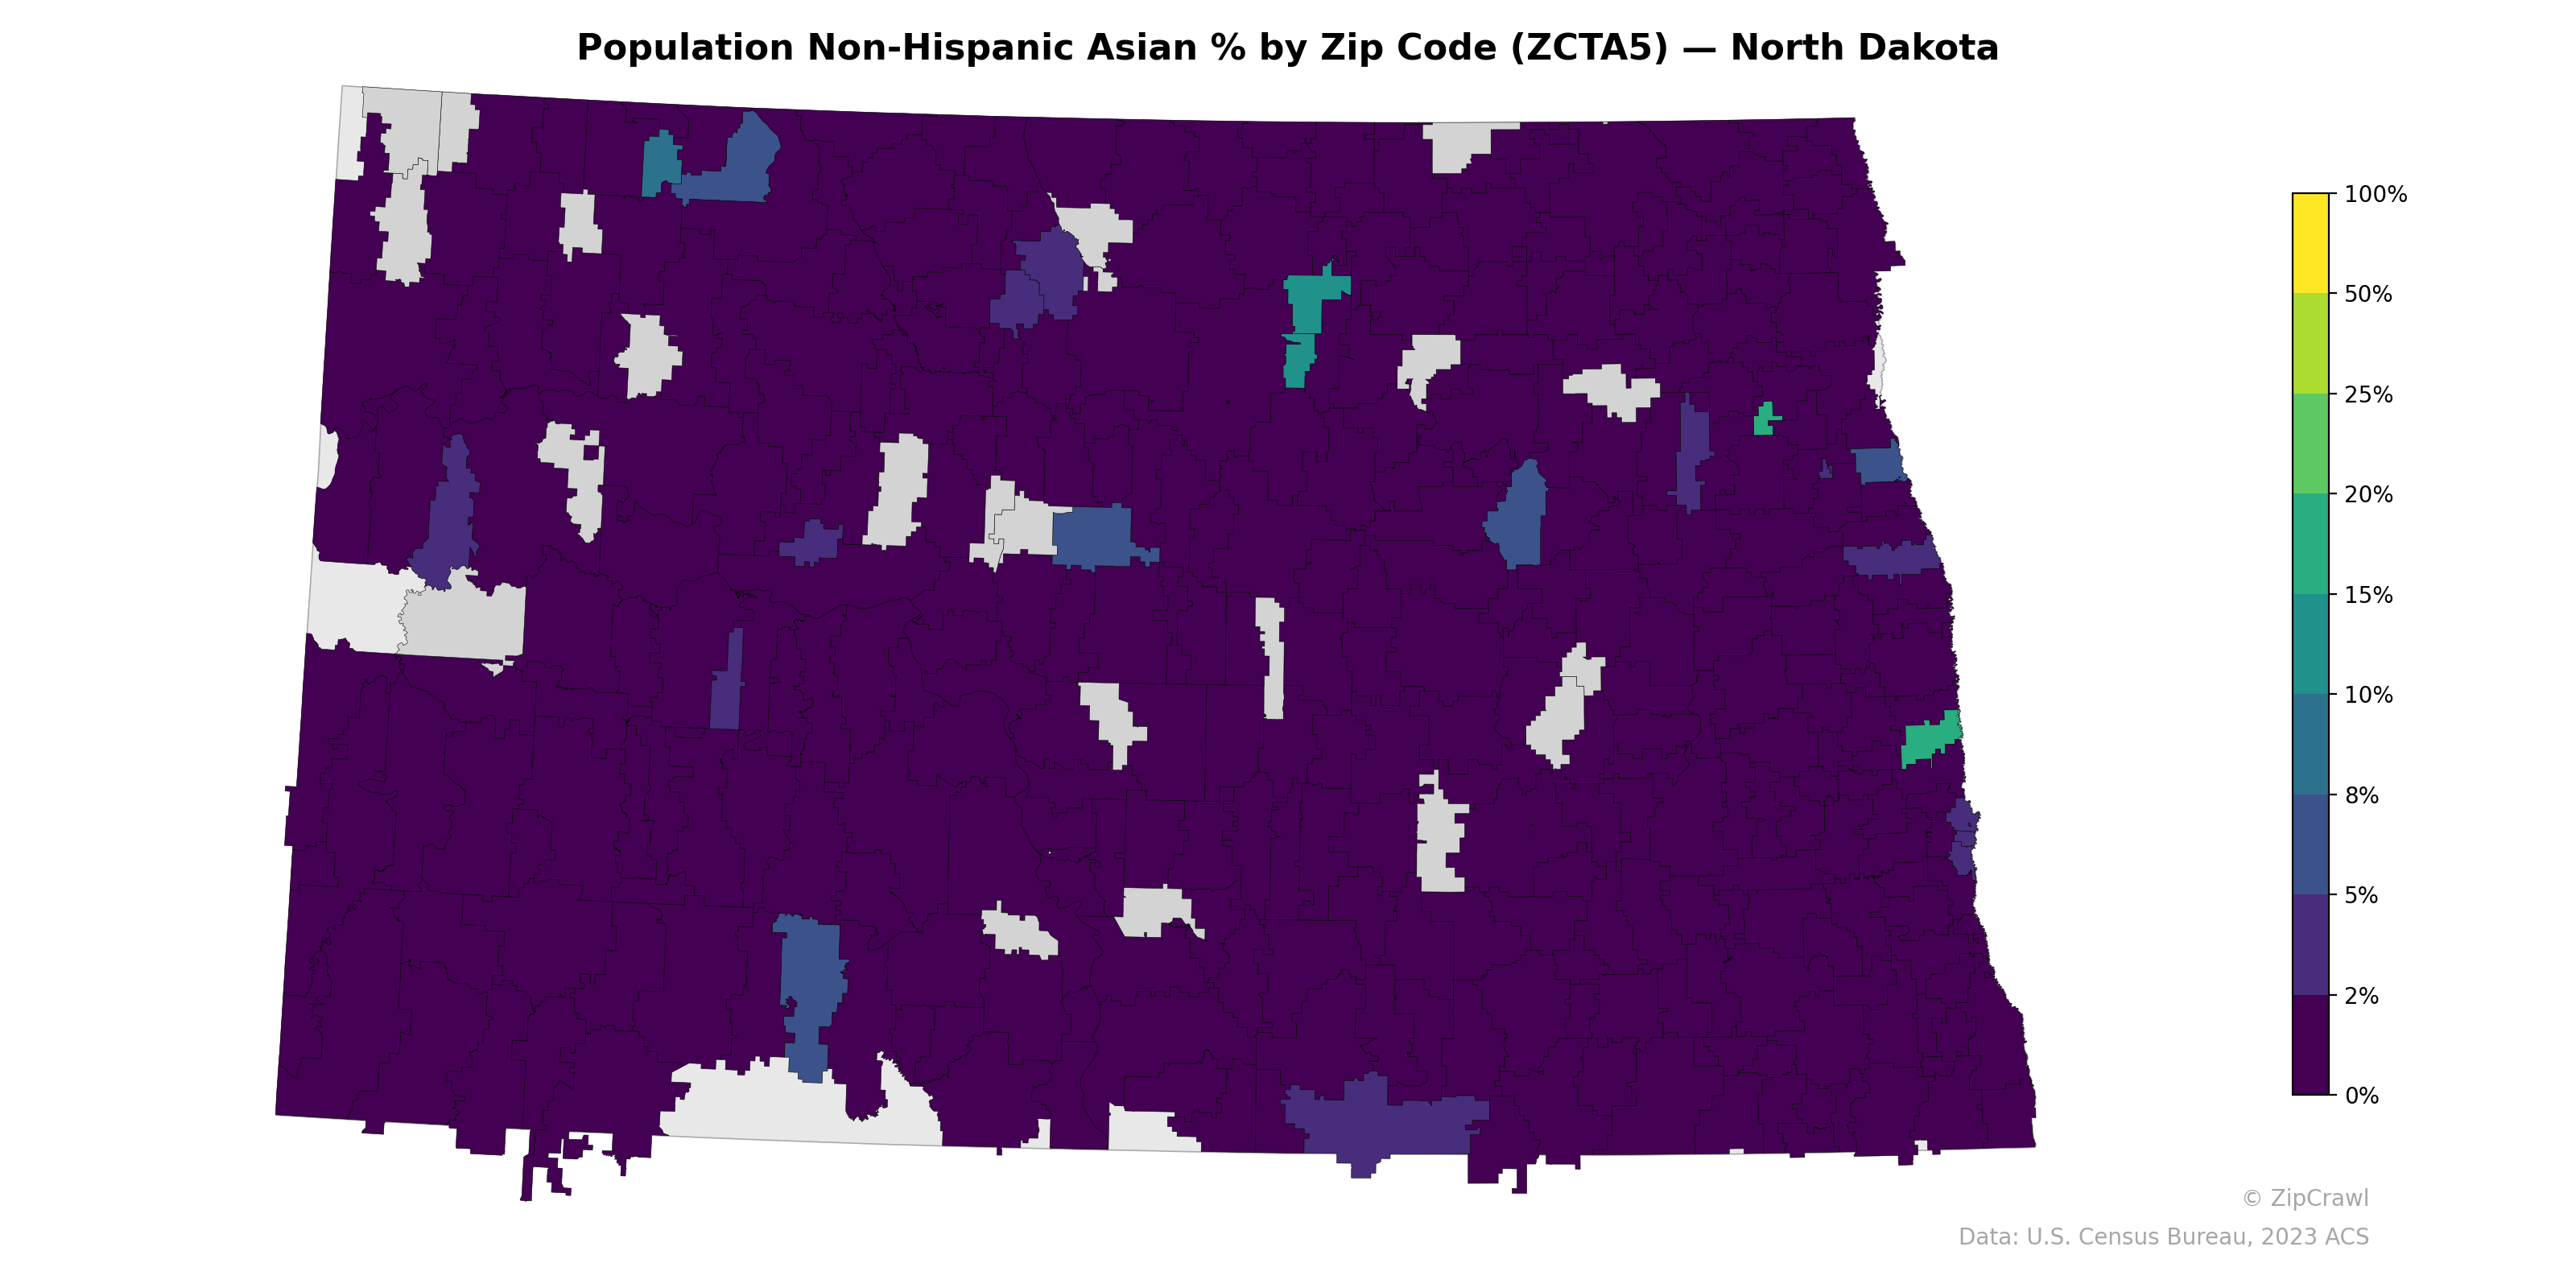
The vast majority of North Dakota zip codes have Non-Hispanic Asian populations below 2%, with the highest concentrations appearing in urban centers such as Fargo in the southeast, Grand Forks in the northeast, and the Minot area in the north-central region, where percentages reach into the 5–10% range. Several zip codes associated with military installations and university towns—notably Grand Forks Air Force Base and areas near North Dakota State University—stand out with elevated Asian population shares relative to their surrounding rural landscapes. The western oil patch region around Williston also shows slightly elevated percentages compared to the deeply rural central and southwestern portions of the state, which remain uniformly near 0%.
Data: U.S. Census Bureau, 2023 ACS
Explore
- Household Average Size by Zip Code (ZCTA5) — New York
- Household Median Income by Zip Code (ZCTA5) — Alaska
- Population Hispanic % by Zip Code (ZCTA5) — Alaska
- Population Non-Hispanic White % by Zip Code (ZCTA5) — Alaska
- Median Age by Zip Code (ZCTA5) — Alaska
- Population Non-Hispanic Black % by Zip Code (ZCTA5) — Alaska
- % of Population on Food Stamps or SNAP (Last 12 Months), by Zip Code (ZCTA5) — North Dakota
- Housing Vacancy Rate by Zip Code (ZCTA5) — North Dakota
- U.S. Citizens (% of Population Over 18) by Zip Code (ZCTA5) — Alaska
- Married Couple (% of all Households) by Zip Code (ZCTA5) — North Dakota
- Household Average Size by County
- % of Population without Health Insurance, by Zip Code (ZCTA5) — Missouri
- Married Couple (% of all Households) by Zip Code (ZCTA5) — New York
- % of Population without Health Insurance, by Zip Code (ZCTA5) — Illinois
- Housing Median Monthly Rent ($), by Zip Code (ZCTA5) — New York
- Housing Owner-Occupied % of Units, by Zip Code (ZCTA5) — New York
- Housing % of Units Built Since 2010, by Zip Code (ZCTA5) — New York
- Housing Vacancy Rate by Zip Code (ZCTA5) — New York
- Bachelor's Degree or Higher (% of Over 25) by Zip Code (ZCTA5) — New York
- % of Population without Health Insurance, by Zip Code (ZCTA5) — New York
- % of Households with Broadband Internet, by Zip Code (ZCTA5) — New York
- Housing Owner-Occupied Median Value ($), by Zip Code (ZCTA5) — New York
- Population Non-Hispanic American Indian % by Zip Code (ZCTA5) — North Dakota
- Population Non-Hispanic American Indian % by Zip Code (ZCTA5) — Rhode Island
- Household Average Size by Zip Code (ZCTA5) — Rhode Island
- High School Graduate (% of Over 25) by Zip Code (ZCTA5) — Rhode Island
- Housing Vacancy Rate by Zip Code (ZCTA5) — Alaska
- Population Non-Hispanic Black % by Zip Code (ZCTA5) — North Dakota
- Housing Median Monthly Rent ($), by Zip Code (ZCTA5) — Rhode Island
- Population Non-Hispanic White % by Zip Code (ZCTA5) — Oregon
- Population Non-Hispanic Asian % by Zip Code (ZCTA5) — South Dakota
- Population Non-Hispanic Asian % by Zip Code (ZCTA5) — North Carolina
- Population Non-Hispanic Asian % by Zip Code (ZCTA5) — Ohio
- Population Non-Hispanic Asian % by Zip Code (ZCTA5) — Utah
- Population Non-Hispanic Asian % by Zip Code (ZCTA5) — Iowa
- Population Non-Hispanic Asian % by Zip Code (ZCTA5) — Minnesota
- Population Non-Hispanic Asian % by Zip Code (ZCTA5) — Nevada
- Population Non-Hispanic Asian % by Zip Code (ZCTA5) — Texas
- Population Non-Hispanic Asian % by Zip Code (ZCTA5) — Idaho
- Population Non-Hispanic Asian % by Zip Code (ZCTA5) — Oregon