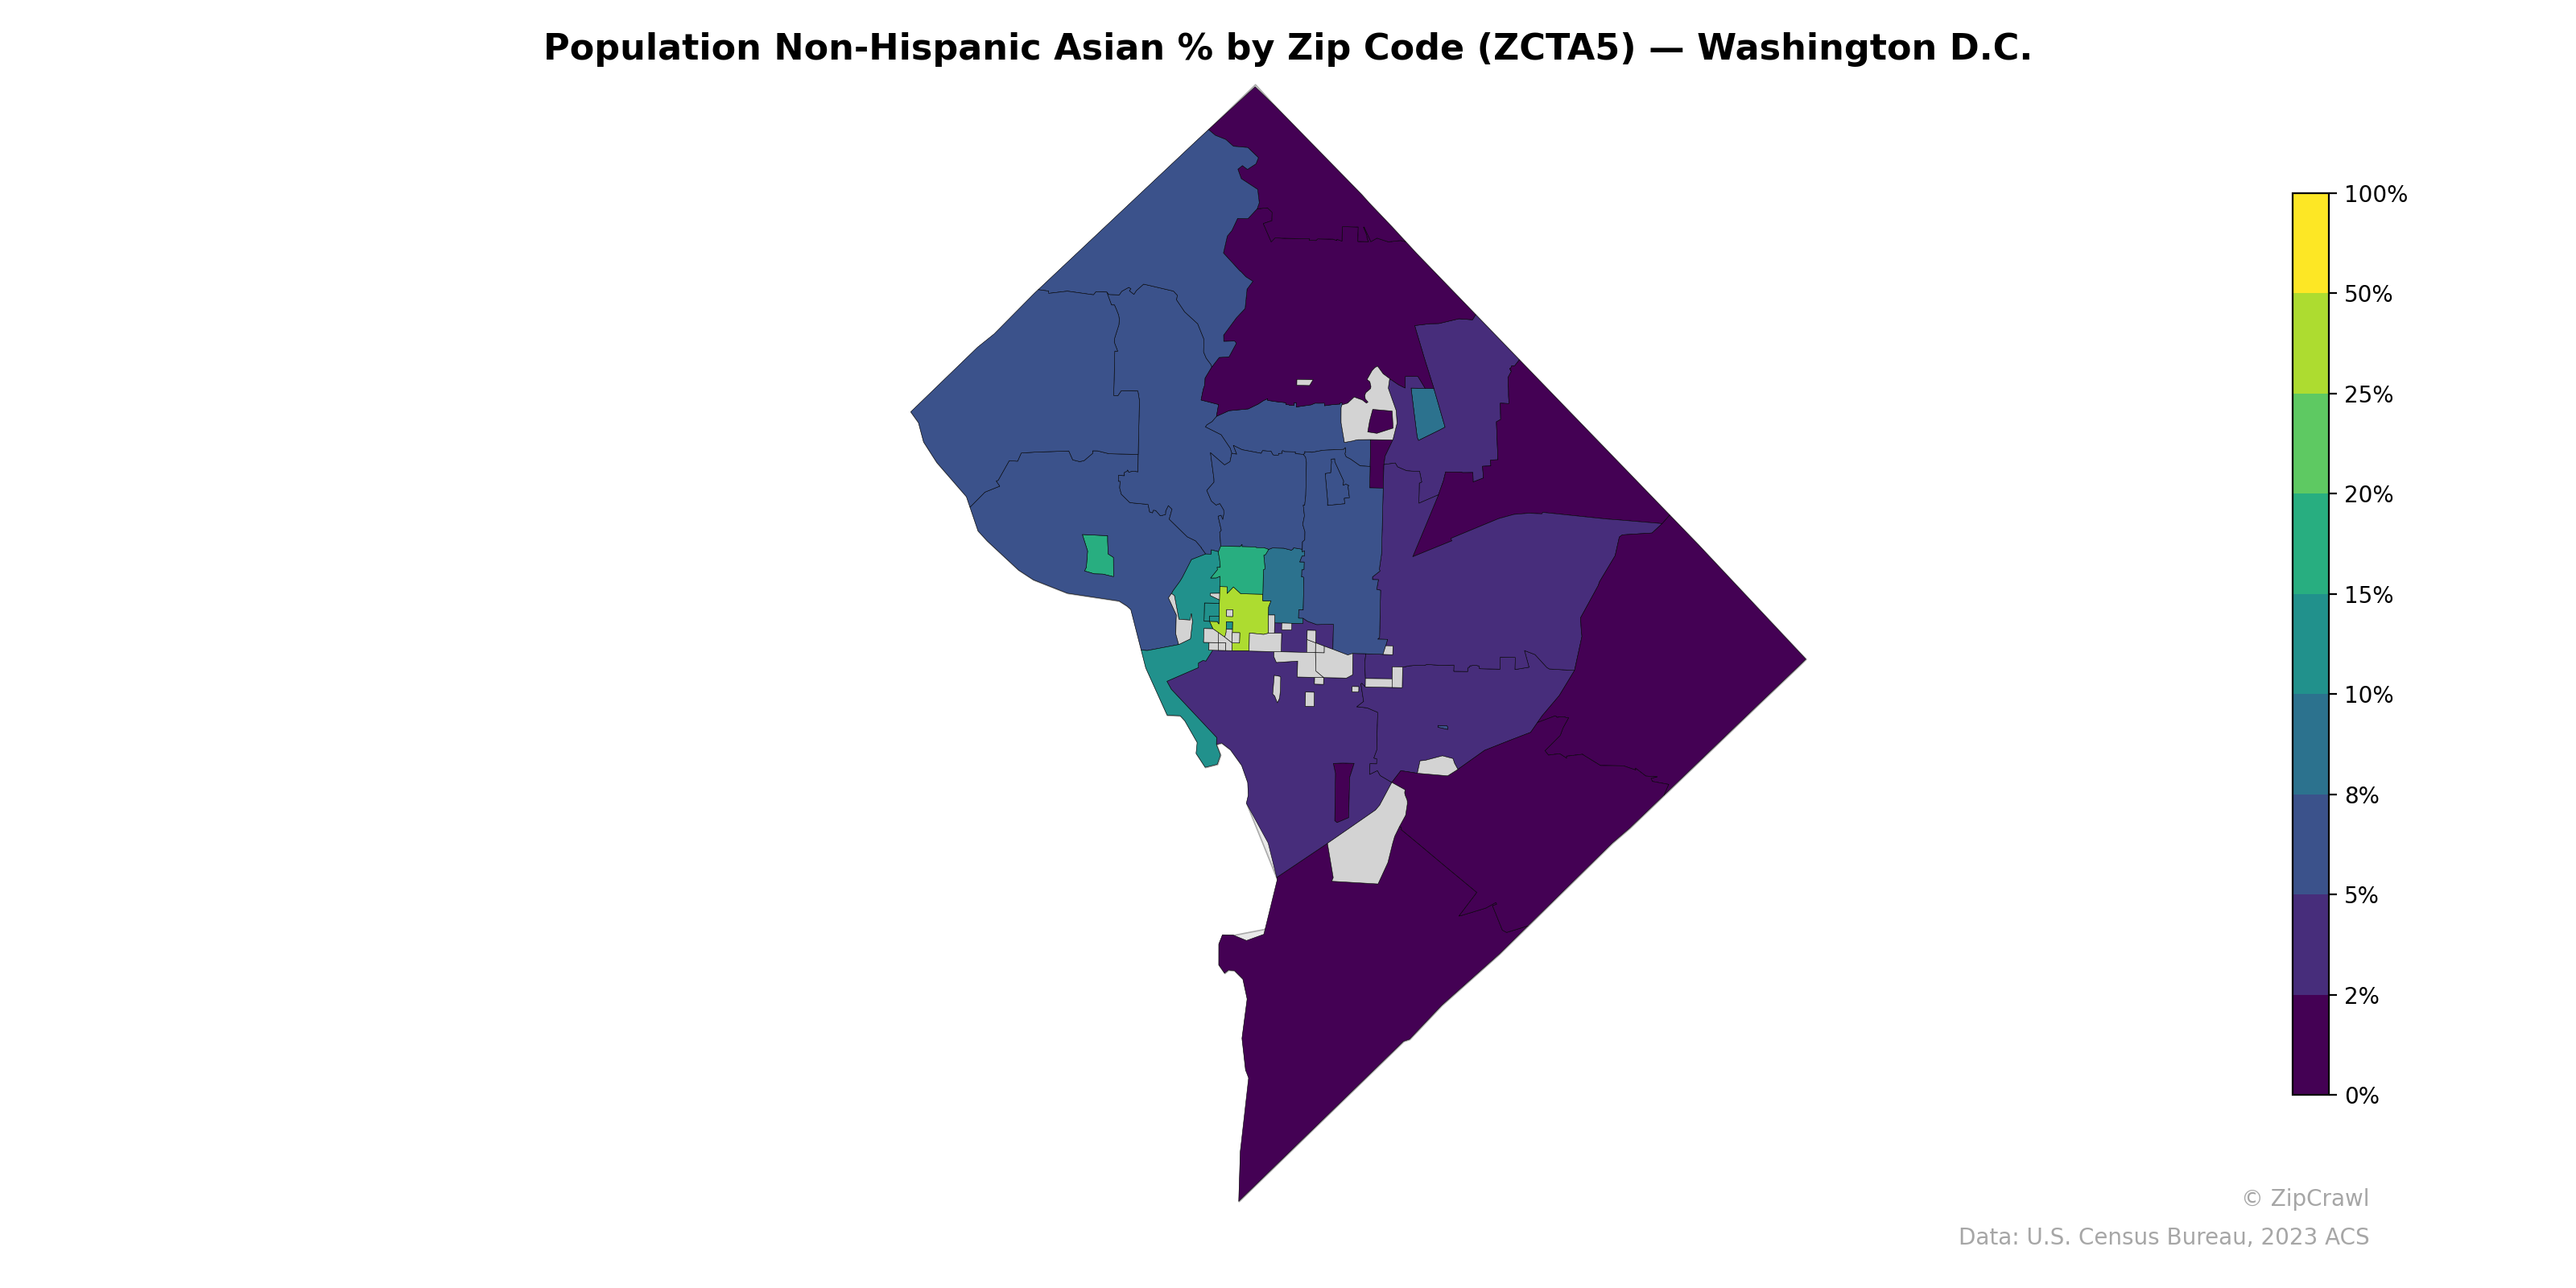
NOTE: Gray indicates insufficient data or a suppressed estimate.
The highest concentrations of Non-Hispanic Asian residents cluster in the central-west portions of the District, particularly around the Chinatown, Cleveland Park, and upper Northwest zip codes, where percentages reach approximately 15–25% or higher. The eastern and southeastern quadrants of the city consistently register the lowest shares, generally below 2–5%, creating a stark east-west demographic divide. A few small zip codes near the downtown core display notably elevated percentages, likely reflecting neighborhoods with dense apartment housing that attract diverse professional populations.
Data: U.S. Census Bureau, 2023 ACS
Explore
- Population Non-Hispanic White % by Zip Code (ZCTA5) — Illinois
- % of Population on Food Stamps or SNAP (Last 12 Months), by Zip Code (ZCTA5) — Washington D.C.
- Housing Vacancy Rate by Zip Code (ZCTA5) — Washington D.C.
- Married Couple (% of all Households) by Zip Code (ZCTA5) — Washington D.C.
- Married Couple (% of all Households) by County
- U.S. Citizens (% of Population Over 18) by Zip Code (ZCTA5) — Illinois
- Median Age by Zip Code (ZCTA5) — Illinois
- Population Non-Hispanic Black % by Zip Code (ZCTA5) — Illinois
- % of Population without Health Insurance, by Zip Code (ZCTA5) — Detroit Metro
- Population Hispanic % by Zip Code (ZCTA5) — Illinois
- Population Non-Hispanic American Indian % by Zip Code (ZCTA5) — Illinois
- Household Median Income by Zip Code (ZCTA5) — Illinois
- % of Population without Health Insurance, by Zip Code (ZCTA5) — New York
- % of Population on Food Stamps or SNAP (Last 12 Months), by Zip Code (ZCTA5) — New York
- High School Graduate (% of Over 25) by Zip Code (ZCTA5) — Illinois
- Housing Vacancy Rate by Zip Code (ZCTA5) — Vermont
- % of Households with Broadband Internet, by Zip Code (ZCTA5) — Vermont
- % of Population on Food Stamps or SNAP (Last 12 Months), by Zip Code (ZCTA5) — Vermont
- Household Average Size by Zip Code (ZCTA5) — Vermont
- % of Population without Health Insurance, by Zip Code (ZCTA5) — Vermont
- Married Couple (% of all Households) by Zip Code (ZCTA5) — Vermont
- U.S. Citizens (% of Population Over 18) by Zip Code (ZCTA5) — Wyoming
- Housing Owner-Occupied Median Value ($), by Zip Code (ZCTA5) — Vermont
- Housing Owner-Occupied % of Units, by Zip Code (ZCTA5) — Oregon
- Housing Median Monthly Rent ($), by Zip Code (ZCTA5) — Vermont
- Population Hispanic % by Zip Code (ZCTA5) — Washington D.C.
- Population Non-Hispanic American Indian % by Zip Code (ZCTA5) — Vermont
- High School Graduate (% of Over 25) by Zip Code (ZCTA5) — Vermont
- Bachelor's Degree or Higher (% of Over 25) by Zip Code (ZCTA5) — Vermont
- Housing Owner-Occupied % of Units, by Zip Code (ZCTA5) — Vermont
- Population Non-Hispanic Asian % by Zip Code (ZCTA5) — Washington
- Population Non-Hispanic Asian % by Zip Code (ZCTA5) — Washington D.C. Metro
- Population Non-Hispanic Asian % by Zip Code (ZCTA5) — Wyoming
- Population Non-Hispanic Asian % by Zip Code (ZCTA5) — Iowa
- Population Non-Hispanic Asian % by Zip Code (ZCTA5) — Utah
- Population Non-Hispanic Asian % by Zip Code (ZCTA5) — Ohio
- Population Non-Hispanic Asian % by Zip Code (ZCTA5) — Texas
- Population Non-Hispanic Asian % by Zip Code (ZCTA5) — Idaho
- Population Non-Hispanic Asian % by Zip Code (ZCTA5) — Oregon
- Population Non-Hispanic Asian % by Zip Code (ZCTA5) — Nevada