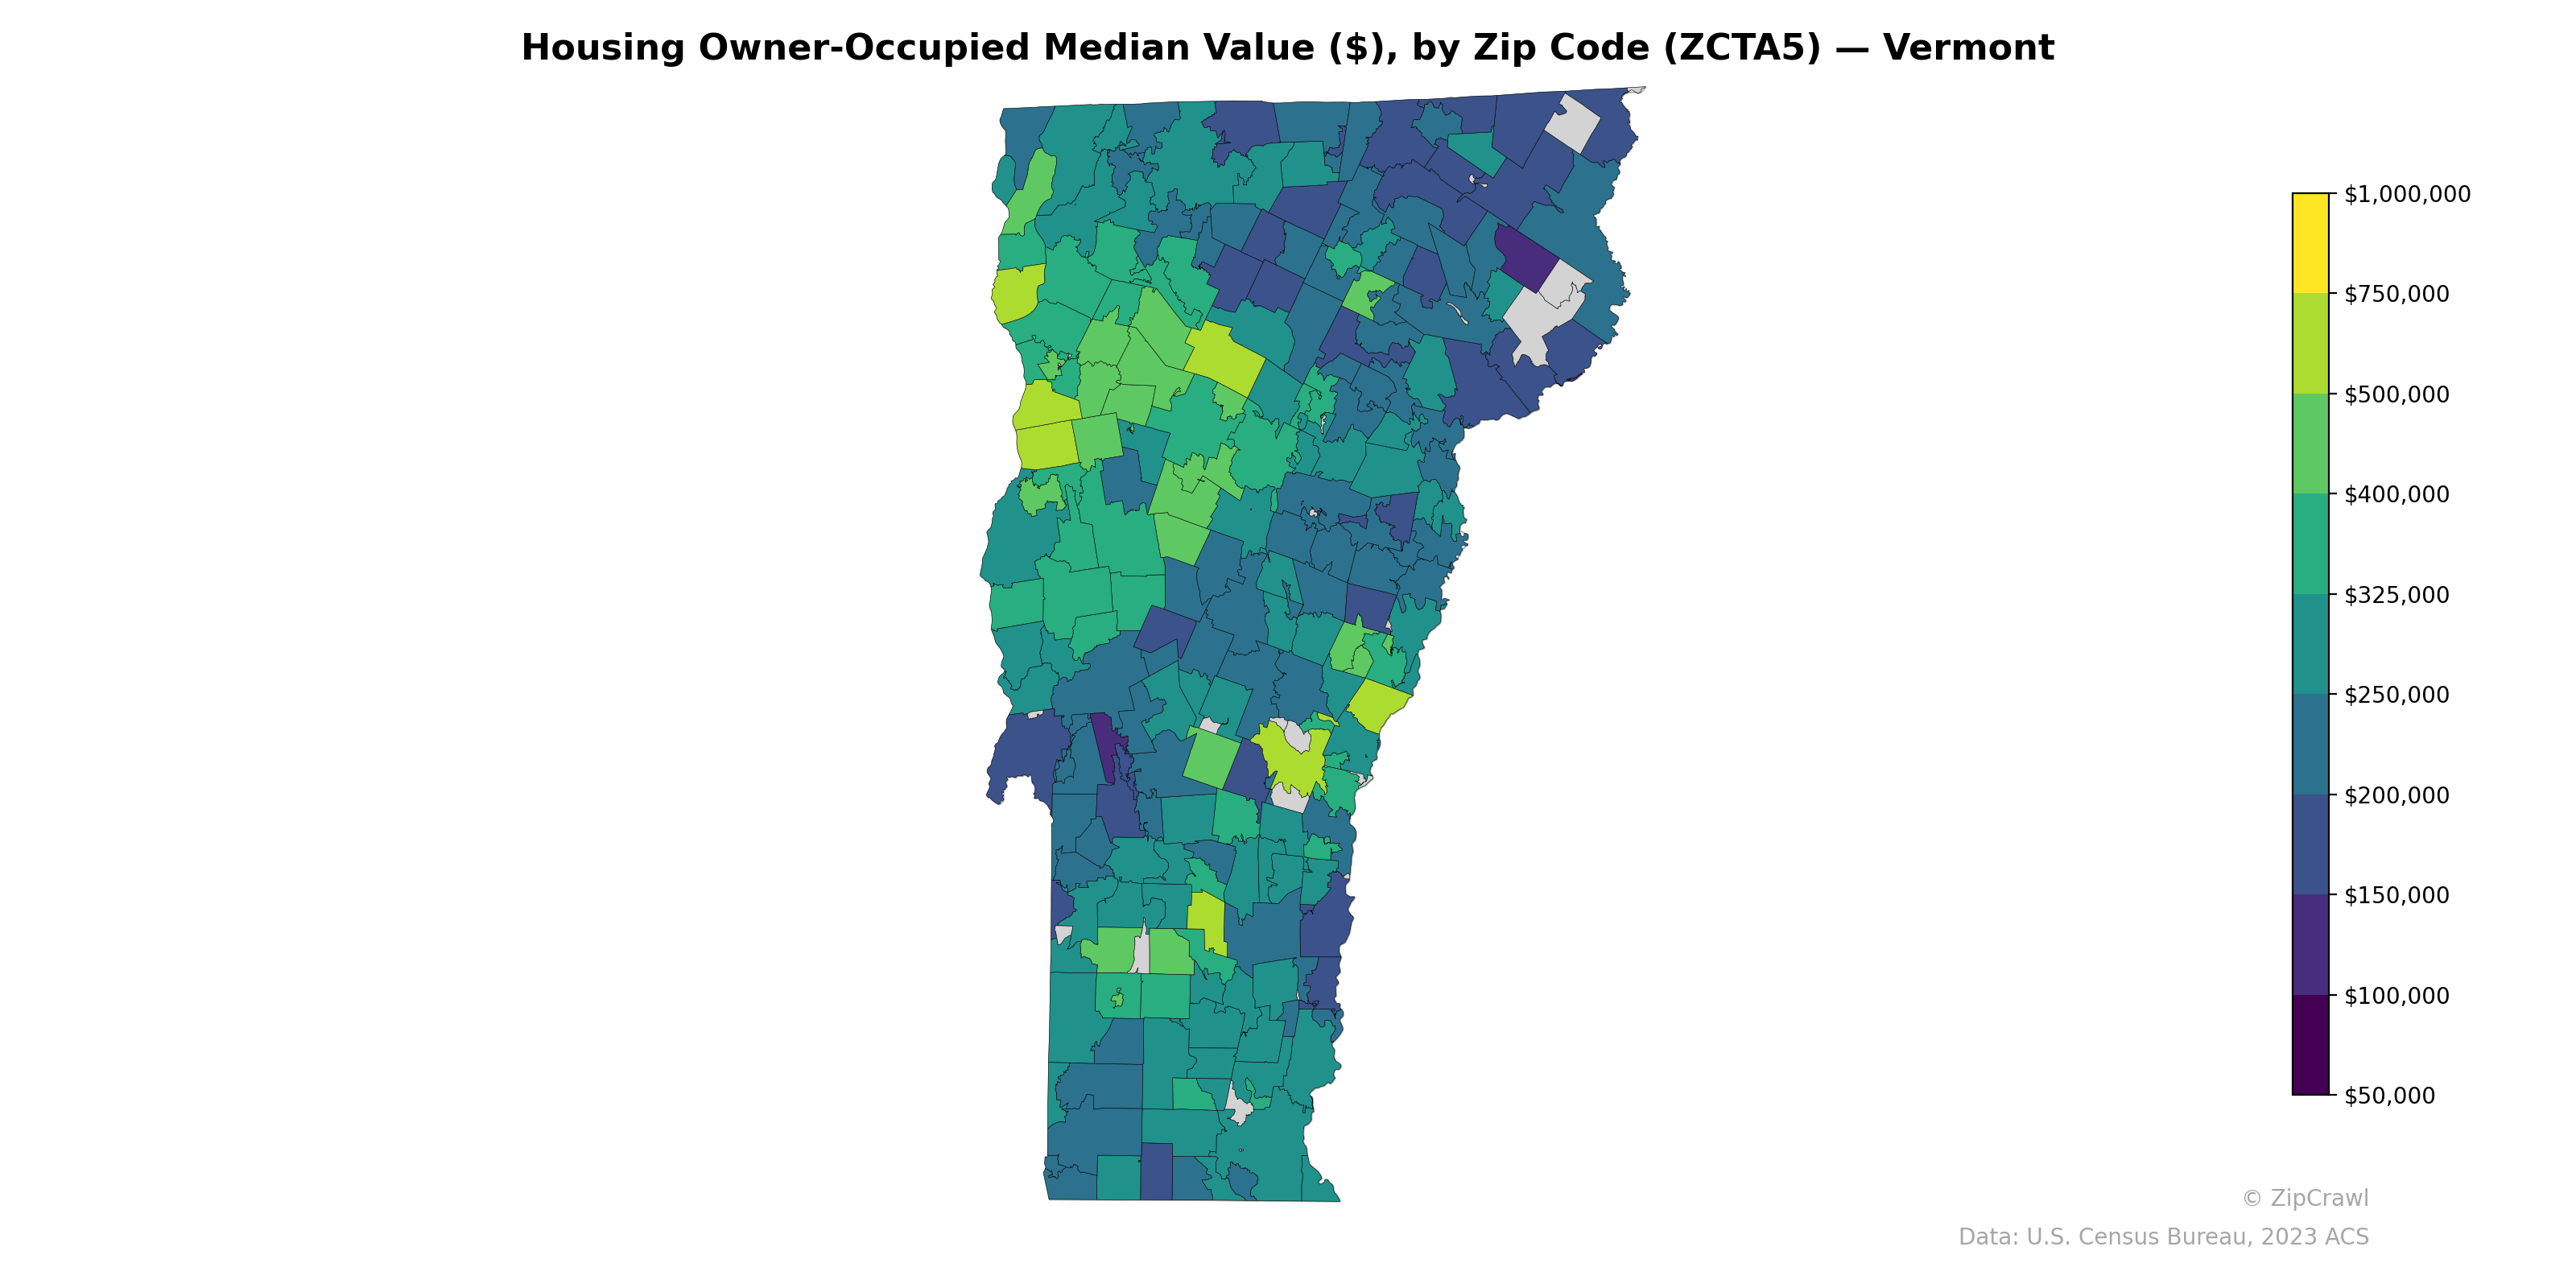
NOTE: Gray indicates insufficient data or a suppressed estimate.
Median owner-occupied home values in Vermont cluster highest along the northwestern corridor near Burlington and in several zip codes in the central-western Green Mountain region, where values frequently reach $400,000–$750,000+. The Northeast Kingdom and parts of southern Vermont's interior display notably lower median values, generally falling in the $150,000–$250,000 range, creating a stark east-west and north-south divide. A few isolated high-value zip codes appear in southern Vermont near resort areas such as those around Stowe and the Mad River Valley, contrasting sharply with adjacent lower-value zones.
Data: U.S. Census Bureau, 2023 ACS
Explore
- Population Non-Hispanic Asian % by Zip Code (ZCTA5) — New York
- Population Non-Hispanic American Indian % by Zip Code (ZCTA5) — Vermont
- High School Graduate (% of Over 25) by Zip Code (ZCTA5) — Vermont
- Bachelor's Degree or Higher (% of Over 25) by Zip Code (ZCTA5) — Vermont
- % of Households with Broadband Internet, by Zip Code (ZCTA5) — Vermont
- % of Population without Health Insurance, by Zip Code (ZCTA5) — Vermont
- Household Average Size by Zip Code (ZCTA5) — Vermont
- Housing % of Units Built Since 2010, by Zip Code (ZCTA5) — Vermont
- Housing Owner-Occupied % of Units, by Zip Code (ZCTA5) — Vermont
- Housing Median Monthly Rent ($), by Zip Code (ZCTA5) — Vermont
- Married Couple (% of all Households) by County
- Population Hispanic % by Zip Code (ZCTA5) — Boston Metro
- Population Non-Hispanic American Indian % by Zip Code (ZCTA5) — Illinois
- High School Graduate (% of Over 25) by Zip Code (ZCTA5) — Illinois
- Population Non-Hispanic White % by Zip Code (ZCTA5) — Illinois
- Household Median Income by Zip Code (ZCTA5) — Illinois
- Population Hispanic % by Zip Code (ZCTA5) — Illinois
- Population Hispanic % by Zip Code (ZCTA5) — California
- % of Population on Food Stamps or SNAP (Last 12 Months), by Zip Code (ZCTA5) — New York
- U.S. Citizens (% of Population Over 18) by Zip Code (ZCTA5) — Illinois
- Population Non-Hispanic Black % by Zip Code (ZCTA5) — Illinois
- Median Age by Zip Code (ZCTA5) — Illinois
- Population Non-Hispanic Asian % by Zip Code (ZCTA5) — Vermont
- Population Hispanic % by Zip Code (ZCTA5) — Washington D.C.
- Population Non-Hispanic American Indian % by Zip Code (ZCTA5) — Oregon
- Housing Vacancy Rate by Zip Code (ZCTA5) — Vermont
- % of Population on Food Stamps or SNAP (Last 12 Months), by Zip Code (ZCTA5) — Vermont
- Married Couple (% of all Households) by Zip Code (ZCTA5) — Vermont
- U.S. Citizens (% of Population Over 18) by Zip Code (ZCTA5) — Wyoming
- Household Median Income by Zip Code (ZCTA5) — Wyoming
- Housing Owner-Occupied Median Value ($), by Zip Code (ZCTA5) — Montana
- Housing Owner-Occupied Median Value ($), by Zip Code (ZCTA5) — Ohio
- Housing Owner-Occupied Median Value ($), by Zip Code (ZCTA5) — Utah
- Housing Owner-Occupied Median Value ($), by Zip Code (ZCTA5) — Maine
- Housing Owner-Occupied Median Value ($), by Zip Code (ZCTA5) — Iowa
- Housing Owner-Occupied Median Value ($), by Zip Code (ZCTA5) — Oregon
- Housing Owner-Occupied Median Value ($), by Zip Code (ZCTA5) — Hawaii
- Housing Owner-Occupied Median Value ($), by Zip Code (ZCTA5) — Indiana
- Housing Owner-Occupied Median Value ($), by Zip Code (ZCTA5) — Texas
- Housing Owner-Occupied Median Value ($), by Zip Code (ZCTA5) — Idaho