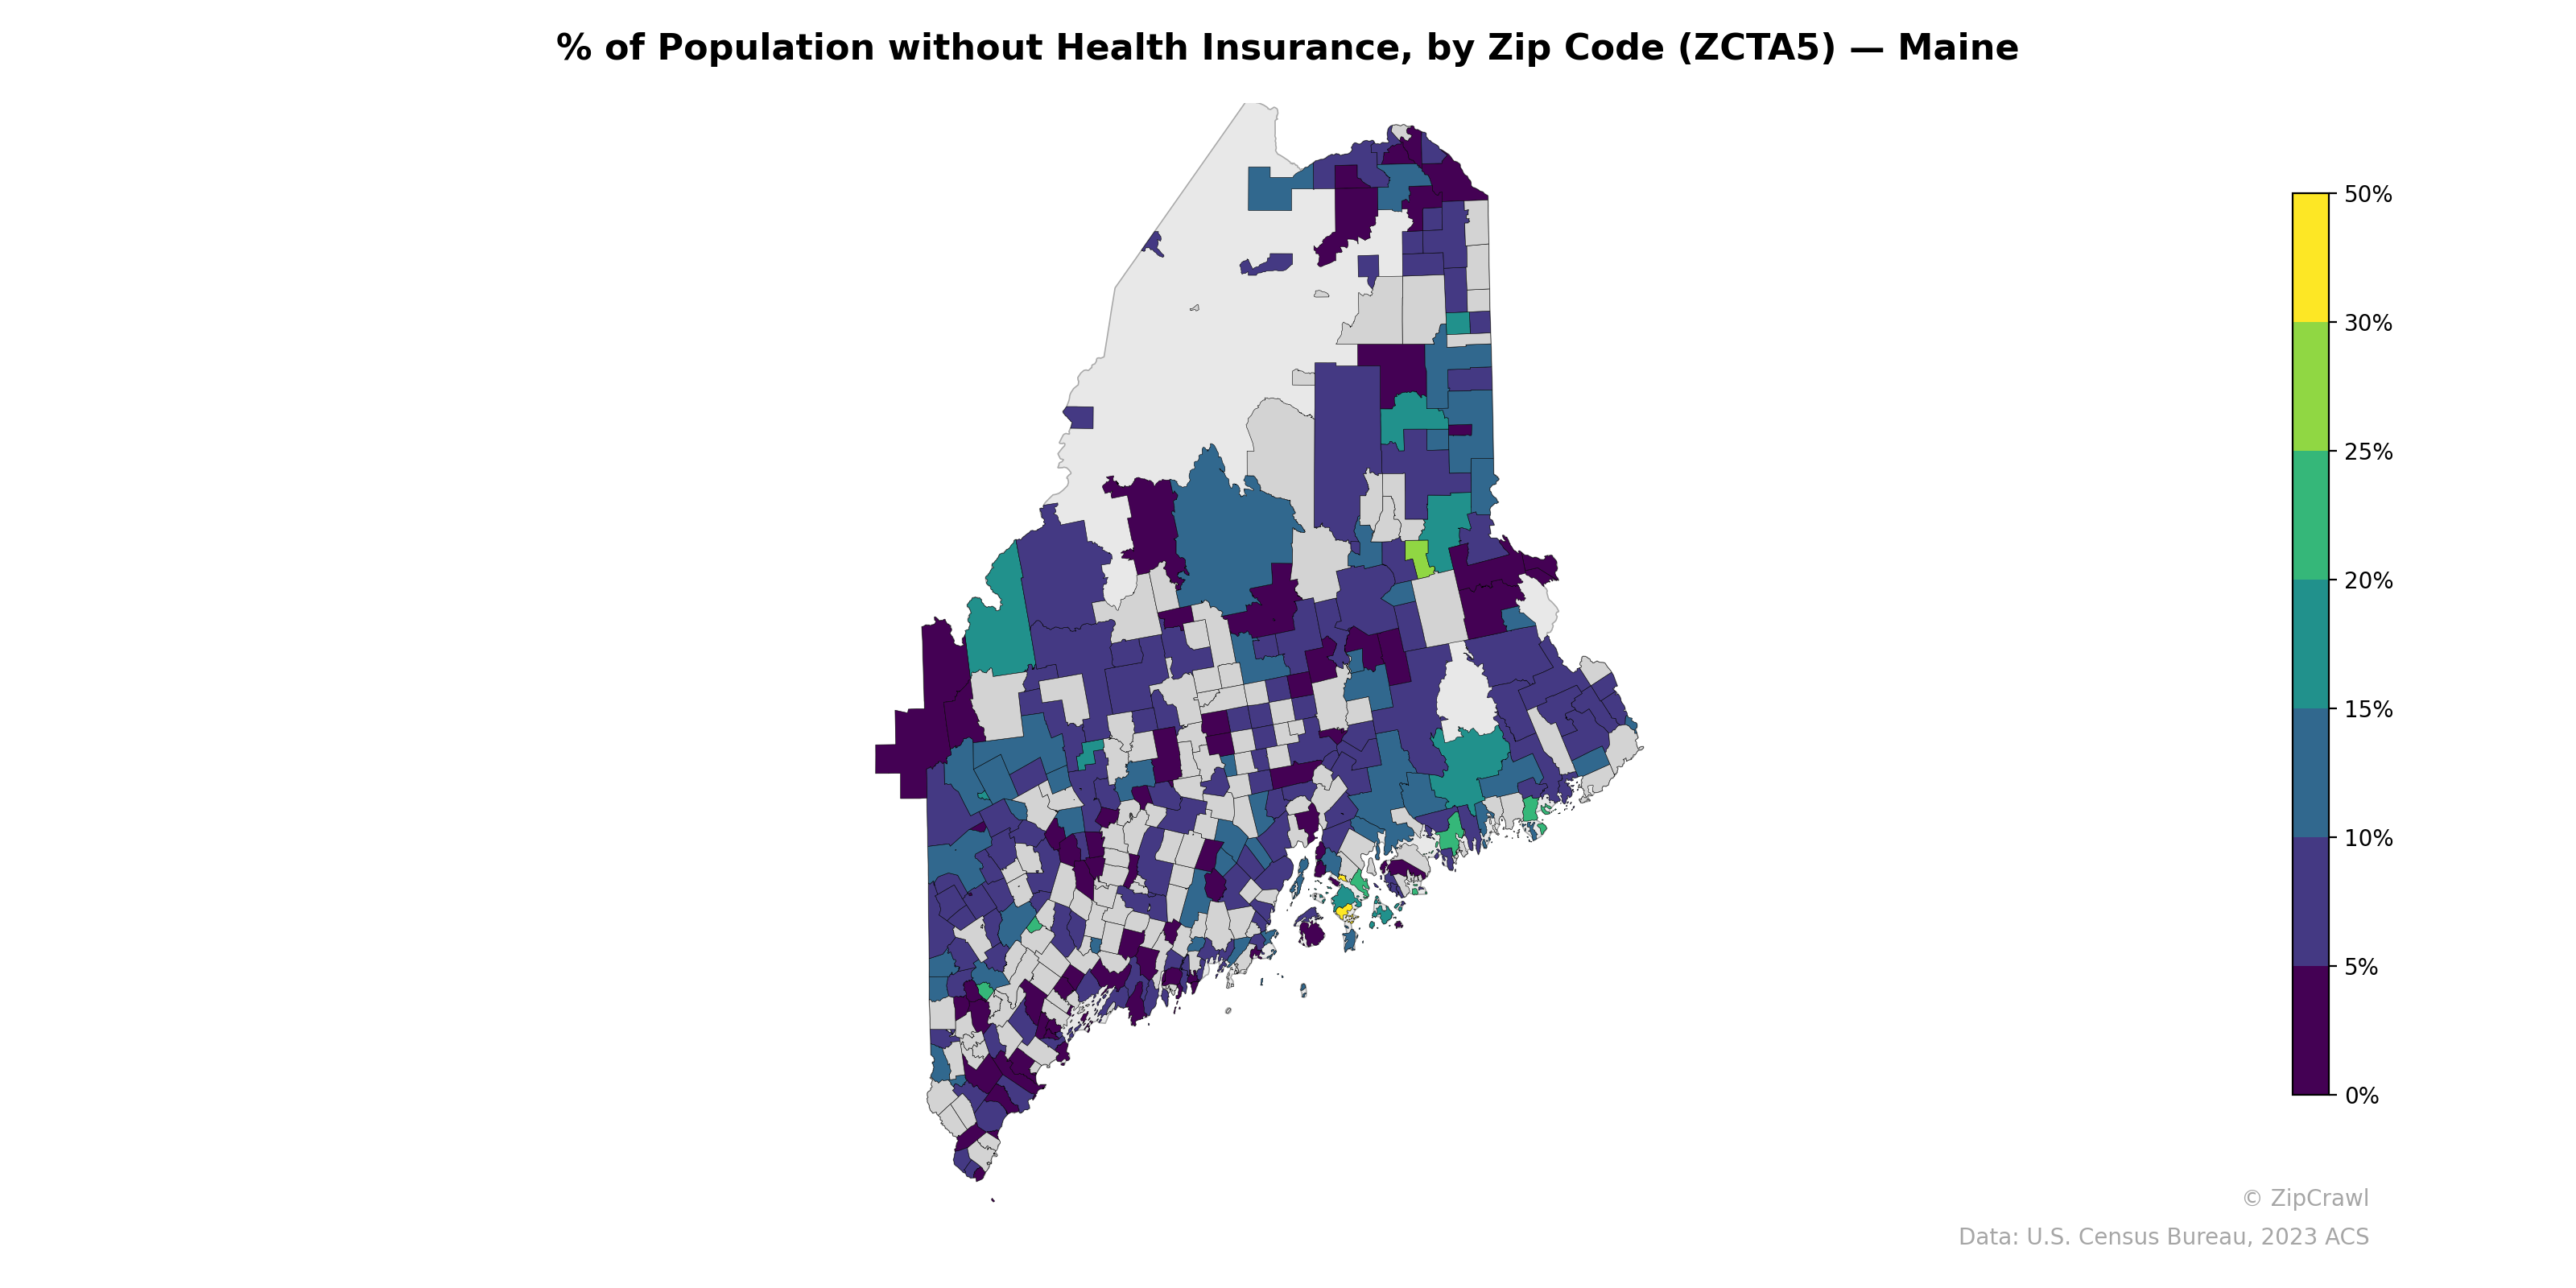
NOTE: Gray indicates insufficient data or a suppressed estimate.
Uninsured rates across Maine's zip codes exhibit considerable geographic variation, with the highest concentrations (20–25%+) appearing in scattered rural areas of the northern interior and along portions of the Downeast coast, while southern coastal and suburban zip codes around Portland and its commuter belt generally report rates below 5–10%. A notable cluster of very low uninsured rates is visible in the southernmost tip of the state, likely reflecting higher employer-sponsored coverage and greater access to insurance marketplaces in more urbanized areas. The large, sparsely populated zip codes of Aroostook County and the northern woods show a patchwork pattern, with some areas reporting moderate-to-high uninsured rates adjacent to zones with no reported data (gray), reflecting limited population density and potential data suppression.
Data: U.S. Census Bureau, 2023 ACS
Explore
- Population Hispanic % by Zip Code (ZCTA5) — New York
- Housing % of Units Built Since 2010, by Zip Code (ZCTA5) — Maine
- Housing Median Monthly Rent ($), by Zip Code (ZCTA5) — Maine
- Housing Owner-Occupied Median Value ($), by Zip Code (ZCTA5) — Maine
- Population Non-Hispanic American Indian % by Zip Code (ZCTA5) — Maine
- Household Average Size by Zip Code (ZCTA5) — Maine
- Housing Owner-Occupied % of Units, by Zip Code (ZCTA5) — Maine
- Bachelor's Degree or Higher (% of Over 25) by Zip Code (ZCTA5) — Maine
- % of Households with Broadband Internet, by Zip Code (ZCTA5) — Maine
- High School Graduate (% of Over 25) by Zip Code (ZCTA5) — Maine
- U.S. Citizens by County (% of Population Over 18)
- Population Non-Hispanic American Indian % by Zip Code (ZCTA5) — New York
- Median Age by Zip Code (ZCTA5) — Washington
- High School Graduate (% of Over 25) by Zip Code (ZCTA5) — New York
- Population Non-Hispanic Black % by Zip Code (ZCTA5) — New York
- Household Median Income by Zip Code (ZCTA5) — New York
- % of Population on Food Stamps or SNAP (Last 12 Months), by Zip Code (ZCTA5) — Florida
- Median Age by Zip Code (ZCTA5) — New York
- Median Age by Zip Code (ZCTA5) — Illinois
- Population Non-Hispanic Asian % by Zip Code (ZCTA5) — Florida
- Population Non-Hispanic White % by Zip Code (ZCTA5) — New York
- U.S. Citizens (% of Population Over 18) by Zip Code (ZCTA5) — New York
- Bachelor's Degree or Higher (% of Over 25) by Zip Code (ZCTA5) — West Virginia
- Population Non-Hispanic American Indian % by Zip Code (ZCTA5) — West Virginia
- Population Non-Hispanic Asian % by Zip Code (ZCTA5) — West Virginia
- Population Hispanic % by Zip Code (ZCTA5) — Hawaii
- Married Couple (% of all Households) by Zip Code (ZCTA5) — West Virginia
- % of Households with Broadband Internet, by Zip Code (ZCTA5) — West Virginia
- High School Graduate (% of Over 25) by Zip Code (ZCTA5) — West Virginia
- Housing Vacancy Rate by Zip Code (ZCTA5) — West Virginia
- % of Population without Health Insurance, by Zip Code (ZCTA5) — Ohio
- % of Population without Health Insurance, by Zip Code (ZCTA5) — Iowa
- % of Population without Health Insurance, by Zip Code (ZCTA5) — Maryland
- % of Population without Health Insurance, by Zip Code (ZCTA5) — Oregon
- % of Population without Health Insurance, by Zip Code (ZCTA5) — Idaho
- % of Population without Health Insurance, by Zip Code (ZCTA5) — Utah
- % of Population without Health Insurance, by Zip Code (ZCTA5) — Montana
- % of Population without Health Insurance, by Zip Code (ZCTA5) — Indiana
- % of Population without Health Insurance, by Zip Code (ZCTA5) — Texas
- % of Population without Health Insurance, by Zip Code (ZCTA5) — Hawaii