NOTE: Gray indicates insufficient data or a suppressed estimate.
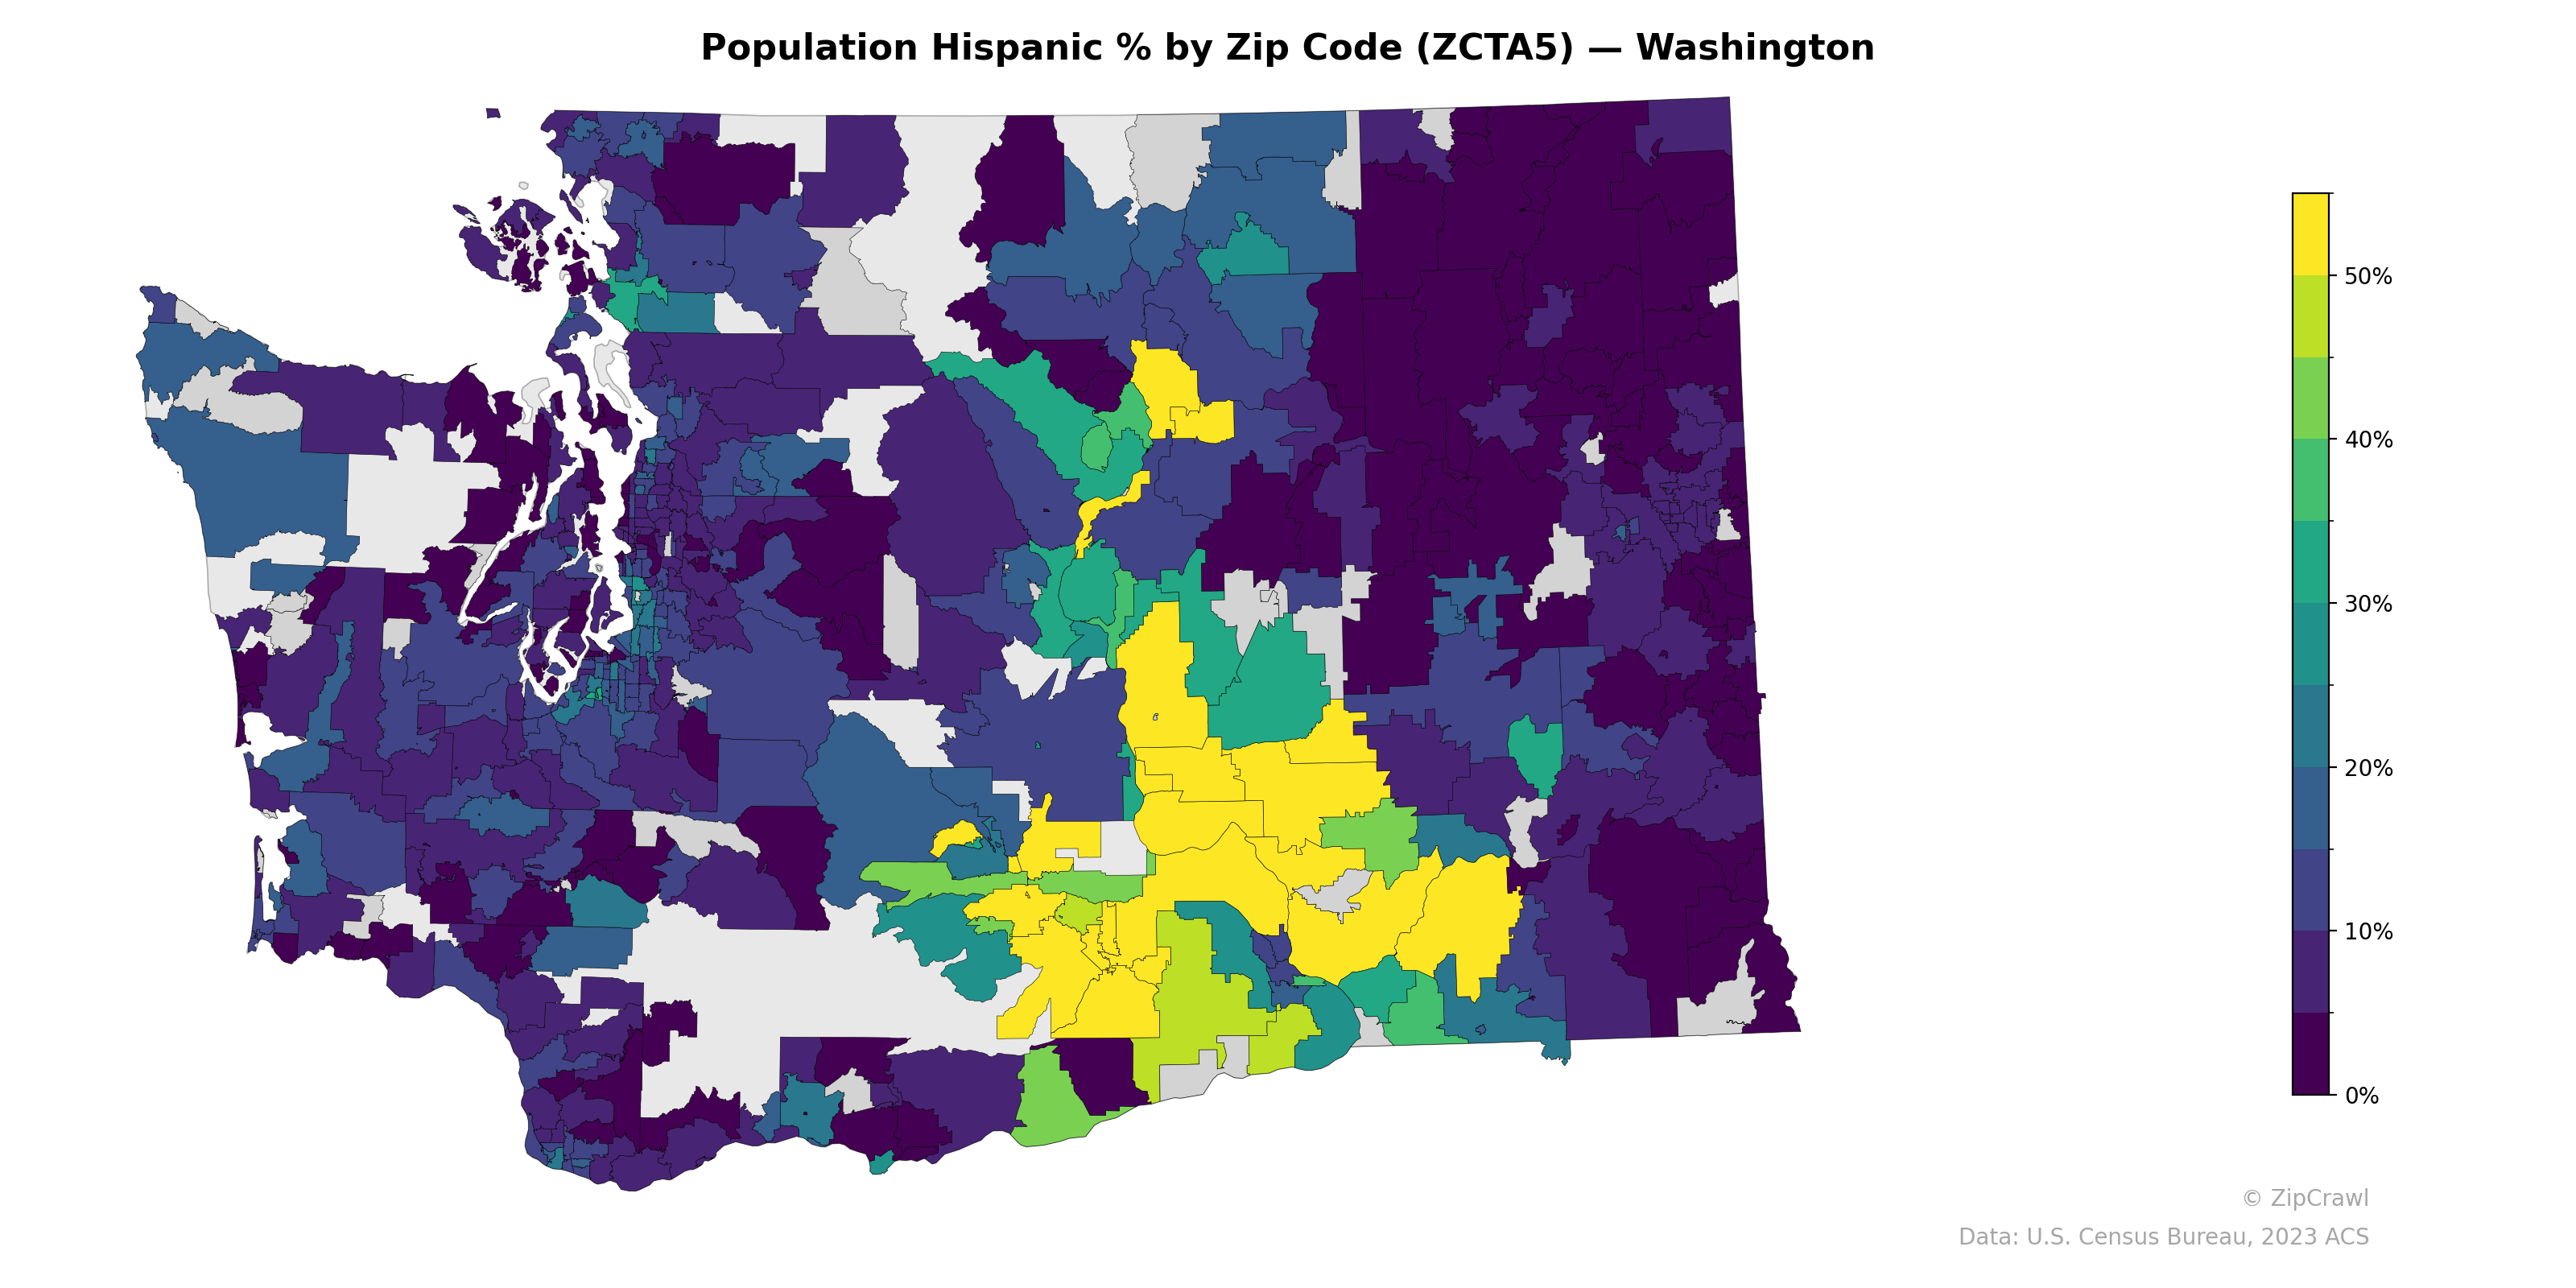
The highest concentrations of Hispanic residents, exceeding 50%, cluster prominently in south-central Washington's Yakima Valley and surrounding agricultural regions, with additional elevated percentages visible in parts of the Columbia Basin and Grant County. The Puget Sound metropolitan corridor—including Seattle, Tacoma, and their suburbs—generally registers below 10-15%, with most western Washington zip codes displaying similarly low percentages. A sharp east-west demographic divide is evident, though the far northeastern corner of the state also maintains very low Hispanic population shares, distinguishing it from the central agricultural belt.
Data: U.S. Census Bureau, 2023 ACS
Explore
- Population Non-Hispanic Asian % by Zip Code (ZCTA5) — Virginia
- Population Non-Hispanic Black % by Zip Code (ZCTA5) — Washington
- Household Median Income by Zip Code (ZCTA5) — Washington
- Population Non-Hispanic White % by Zip Code (ZCTA5) — Washington
- % of Population on Food Stamps or SNAP (Last 12 Months), by Zip Code (ZCTA5) — Virginia
- Population Non-Hispanic American Indian % by Zip Code (ZCTA5) — Washington
- U.S. Citizens (% of Population Over 18) by Zip Code (ZCTA5) — Washington
- High School Graduate (% of Over 25) by Zip Code (ZCTA5) — Washington
- Median Age by Zip Code (ZCTA5) — Washington
- Housing Owner-Occupied Median Value ($), by Zip Code (ZCTA5) — Maine
- Population Non-Hispanic American Indian % by Zip Code (ZCTA5) — Los Angeles Metro
- Population Non-Hispanic White % by Zip Code (ZCTA5) — Los Angeles Metro
- High School Graduate (% of Over 25) by Zip Code (ZCTA5) — Los Angeles Metro
- % of Population on Food Stamps or SNAP (Last 12 Months), by Zip Code (ZCTA5) — New York Metro
- U.S. Citizens (% of Population Over 18) by Zip Code (ZCTA5) — Los Angeles Metro
- Household Median Income by Zip Code (ZCTA5) — Los Angeles Metro
- Median Age by Zip Code (ZCTA5) — Los Angeles Metro
- Population Non-Hispanic Black % by Zip Code (ZCTA5) — Los Angeles Metro
- Housing Vacancy Rate by Zip Code (ZCTA5) — Virginia
- Housing Median Monthly Rent ($), by Zip Code (ZCTA5) — Virginia
- Household Average Size by Zip Code (ZCTA5) — Virginia
- Housing Owner-Occupied % of Units, by Zip Code (ZCTA5) — Virginia
- High School Graduate (% of Over 25) by Zip Code (ZCTA5) — Virginia
- Population Non-Hispanic American Indian % by Zip Code (ZCTA5) — Virginia
- % of Households with Broadband Internet, by Zip Code (ZCTA5) — Virginia
- % of Population without Health Insurance, by Zip Code (ZCTA5) — Virginia
- Bachelor's Degree or Higher (% of Over 25) by Zip Code (ZCTA5) — Virginia
- Housing % of Units Built Since 2010, by Zip Code (ZCTA5) — Virginia
- Married Couple (% of all Households) by Zip Code (ZCTA5) — Virginia
- Housing Owner-Occupied Median Value ($), by Zip Code (ZCTA5) — Virginia
- Population Hispanic % by Zip Code (ZCTA5) — Washington D.C.
- Population Hispanic % by Zip Code (ZCTA5) — Washington D.C. Metro
- Population Hispanic % by Zip Code (ZCTA5) — Wyoming
- Population Hispanic % by Zip Code (ZCTA5) — Utah
- Population Hispanic % by Zip Code (ZCTA5) — Iowa
- Population Hispanic % by Zip Code (ZCTA5) — Ohio
- Population Hispanic % by Zip Code (ZCTA5) — Texas
- Population Hispanic % by Zip Code (ZCTA5) — Oregon
- Population Hispanic % by Zip Code (ZCTA5) — Hawaii
- Population Hispanic % by Zip Code (ZCTA5) — Idaho