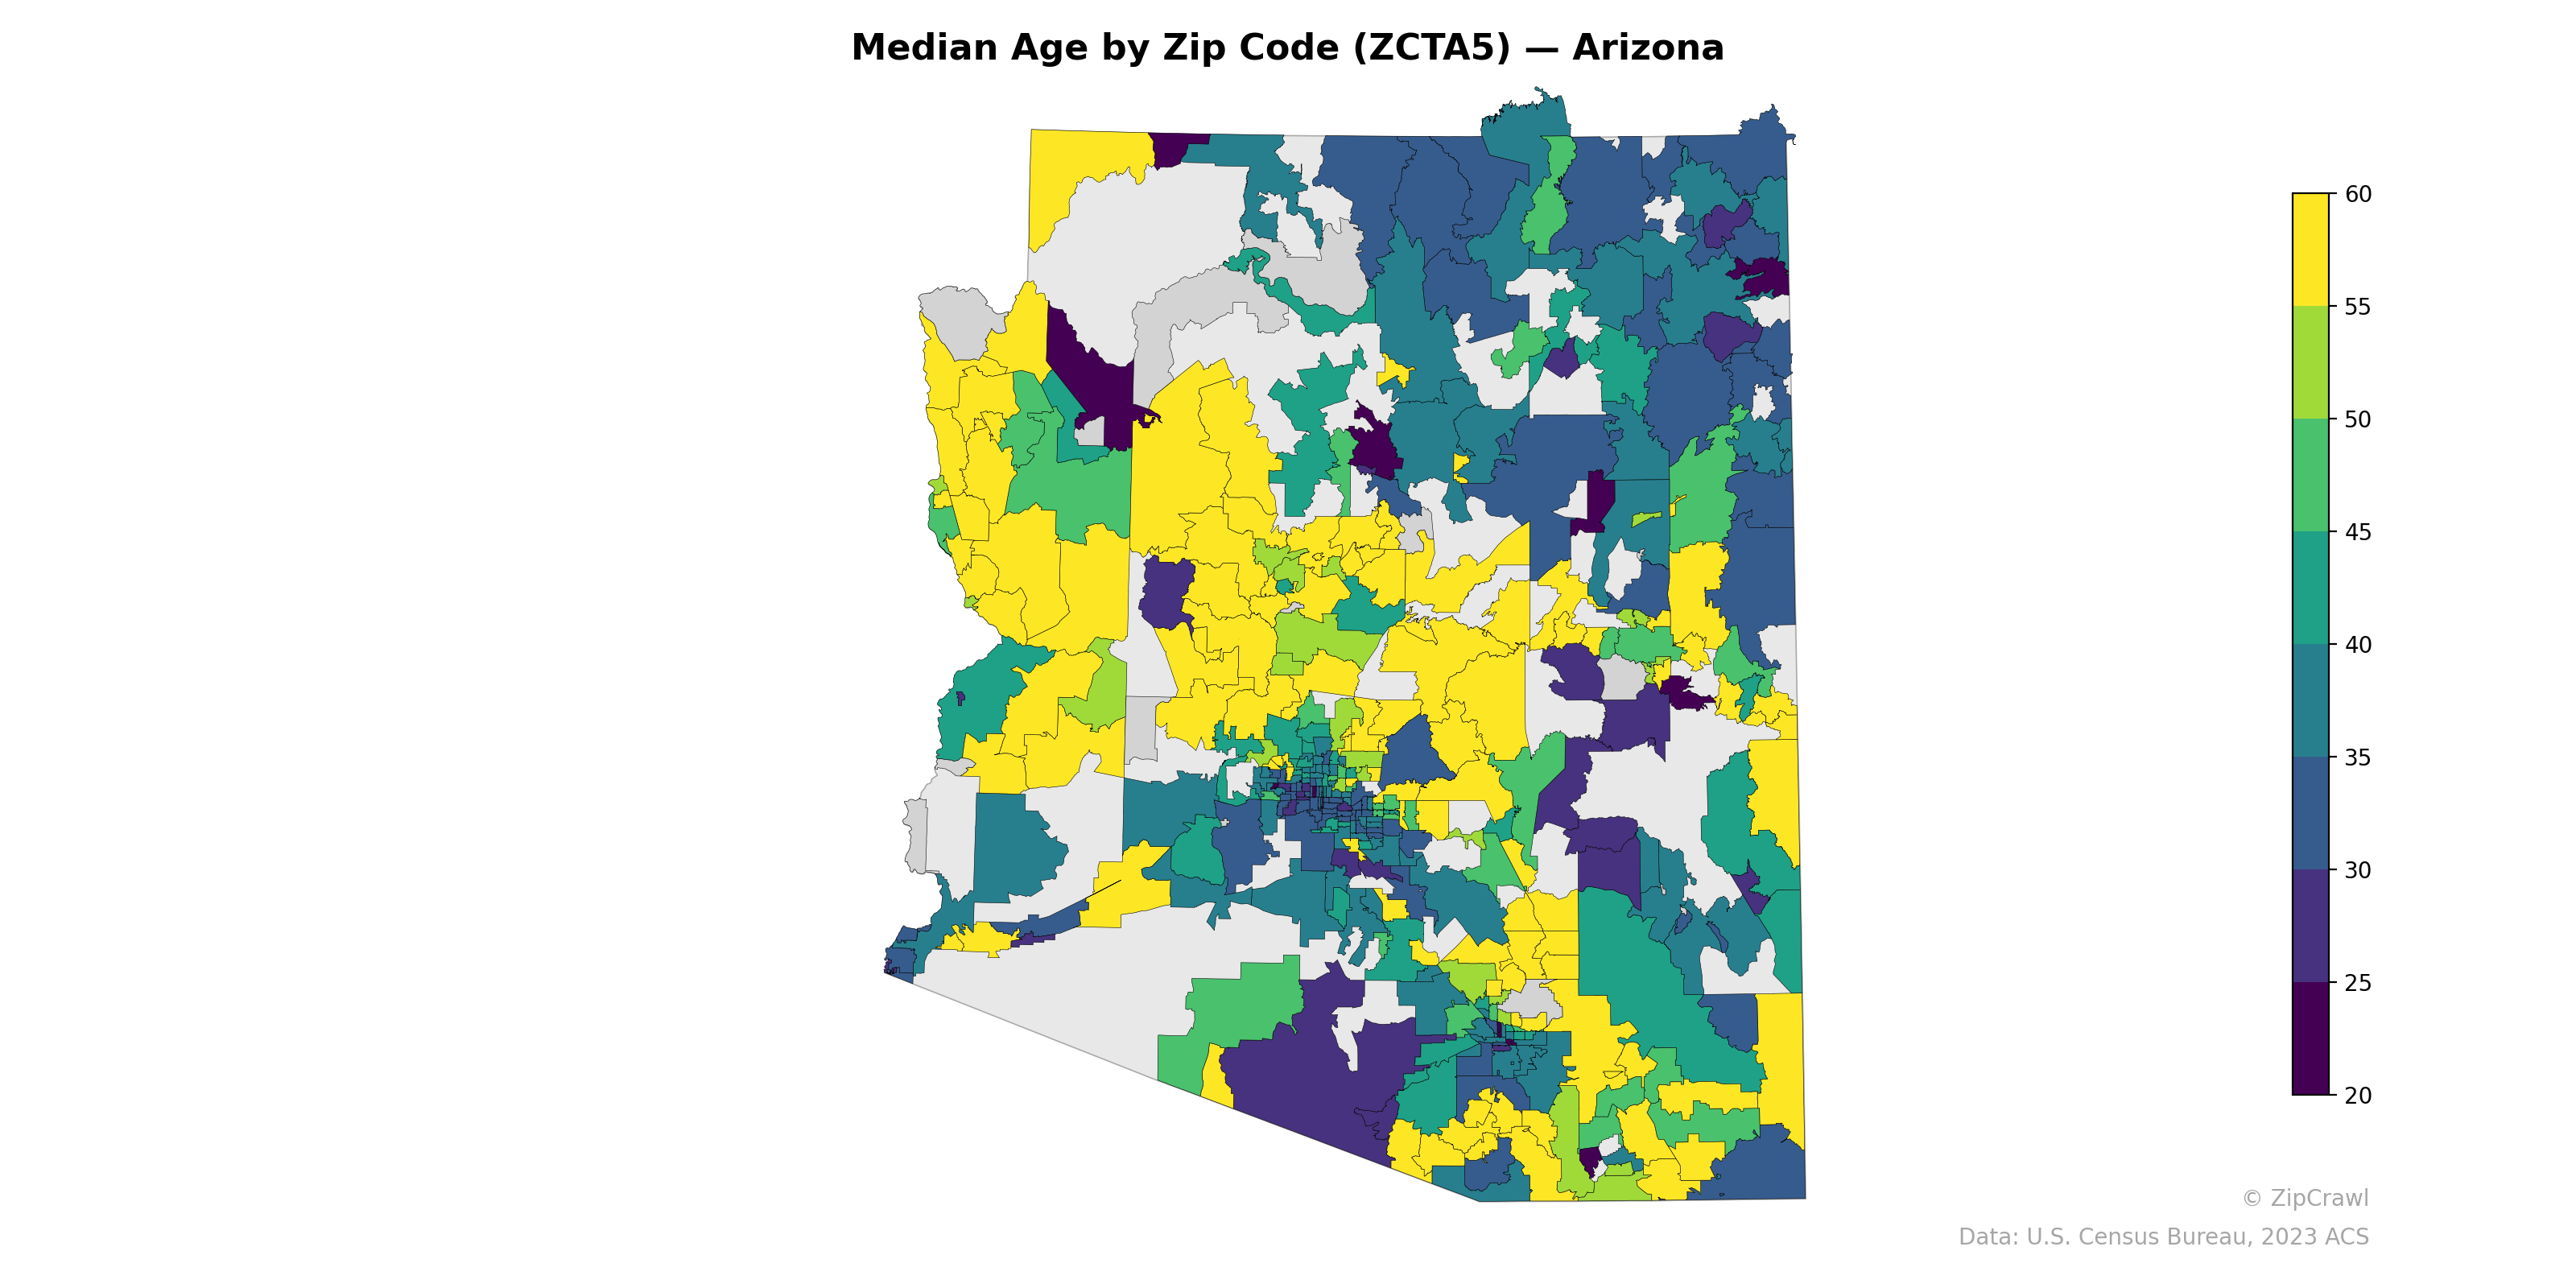
NOTE: Gray indicates insufficient data or a suppressed estimate.
Northeastern Arizona, encompassing the Navajo Nation and surrounding tribal lands, exhibits notably lower median ages in the low-to-mid 20s range, reflecting younger demographic profiles common in Indigenous communities, while retirement-heavy areas in the northwest near Lake Havasu and Bullhead City as well as scattered Sun City-area zip codes in the Phoenix metro skew sharply older with median ages exceeding 55. The central Phoenix metropolitan cluster displays considerable heterogeneity, with university-adjacent zip codes near Tempe appearing in darker teal tones alongside yellow-hued retirement communities just miles away. Southern Arizona shows a mix of moderate median ages in the Tucson metro area, with pockets of younger populations near the U.S.-Mexico border contrasting against older communities in Green Valley and the surrounding Santa Cruz Valley.
Data: U.S. Census Bureau, 2023 ACS
Explore
- Population Non-Hispanic American Indian % by Zip Code (ZCTA5) — Los Angeles Metro
- Population Non-Hispanic American Indian % by Zip Code (ZCTA5) — Arizona
- Population Non-Hispanic Asian % by Zip Code (ZCTA5) — Washington
- Household Median Income by Zip Code (ZCTA5) — Arizona
- % of Population on Food Stamps or SNAP (Last 12 Months), by Zip Code (ZCTA5) — Washington
- U.S. Citizens (% of Population Over 18) by Zip Code (ZCTA5) — Arizona
- High School Graduate (% of Over 25) by Zip Code (ZCTA5) — Arizona
- Population Non-Hispanic Black % by Zip Code (ZCTA5) — Arizona
- Population Hispanic % by Zip Code (ZCTA5) — Arizona
- Population Non-Hispanic White % by Zip Code (ZCTA5) — Arizona
- % of Population without Health Insurance, by Zip Code (ZCTA5) — Montana
- Population Hispanic % by County
- High School Graduate (% of Over 25) by Zip Code (ZCTA5) — Los Angeles Metro
- Population Non-Hispanic White % by Zip Code (ZCTA5) — Los Angeles Metro
- Household Median Income by Zip Code (ZCTA5) — Los Angeles Metro
- U.S. Citizens (% of Population Over 18) by Zip Code (ZCTA5) — Los Angeles Metro
- Population Non-Hispanic Black % by Zip Code (ZCTA5) — Los Angeles Metro
- % of Population on Food Stamps or SNAP (Last 12 Months), by Zip Code (ZCTA5) — New York Metro
- Population Hispanic % by Zip Code (ZCTA5) — Los Angeles Metro
- Housing Vacancy Rate by Zip Code (ZCTA5) — Virginia
- Household Average Size by Zip Code (ZCTA5) — Virginia
- Population Non-Hispanic Asian % by Zip Code (ZCTA5) — Virginia
- % of Households with Broadband Internet, by Zip Code (ZCTA5) — Virginia
- Housing Owner-Occupied % of Units, by Zip Code (ZCTA5) — Virginia
- High School Graduate (% of Over 25) by Zip Code (ZCTA5) — Virginia
- % of Population without Health Insurance, by Zip Code (ZCTA5) — Virginia
- Housing Median Monthly Rent ($), by Zip Code (ZCTA5) — Virginia
- Housing % of Units Built Since 2010, by Zip Code (ZCTA5) — Virginia
- Married Couple (% of all Households) by Zip Code (ZCTA5) — Virginia
- Bachelor's Degree or Higher (% of Over 25) by Zip Code (ZCTA5) — Virginia
- Median Age by Zip Code (ZCTA5) — Indiana
- Median Age by Zip Code (ZCTA5) — Montana
- Median Age by Zip Code (ZCTA5) — Maine
- Median Age by Zip Code (ZCTA5) — Utah
- Median Age by Zip Code (ZCTA5) — Iowa
- Median Age by Zip Code (ZCTA5) — Ohio
- Median Age by Zip Code (ZCTA5) — Arkansas
- Median Age by Zip Code (ZCTA5) — Texas
- Median Age by Zip Code (ZCTA5) — Idaho
- Median Age by Zip Code (ZCTA5) — Alaska