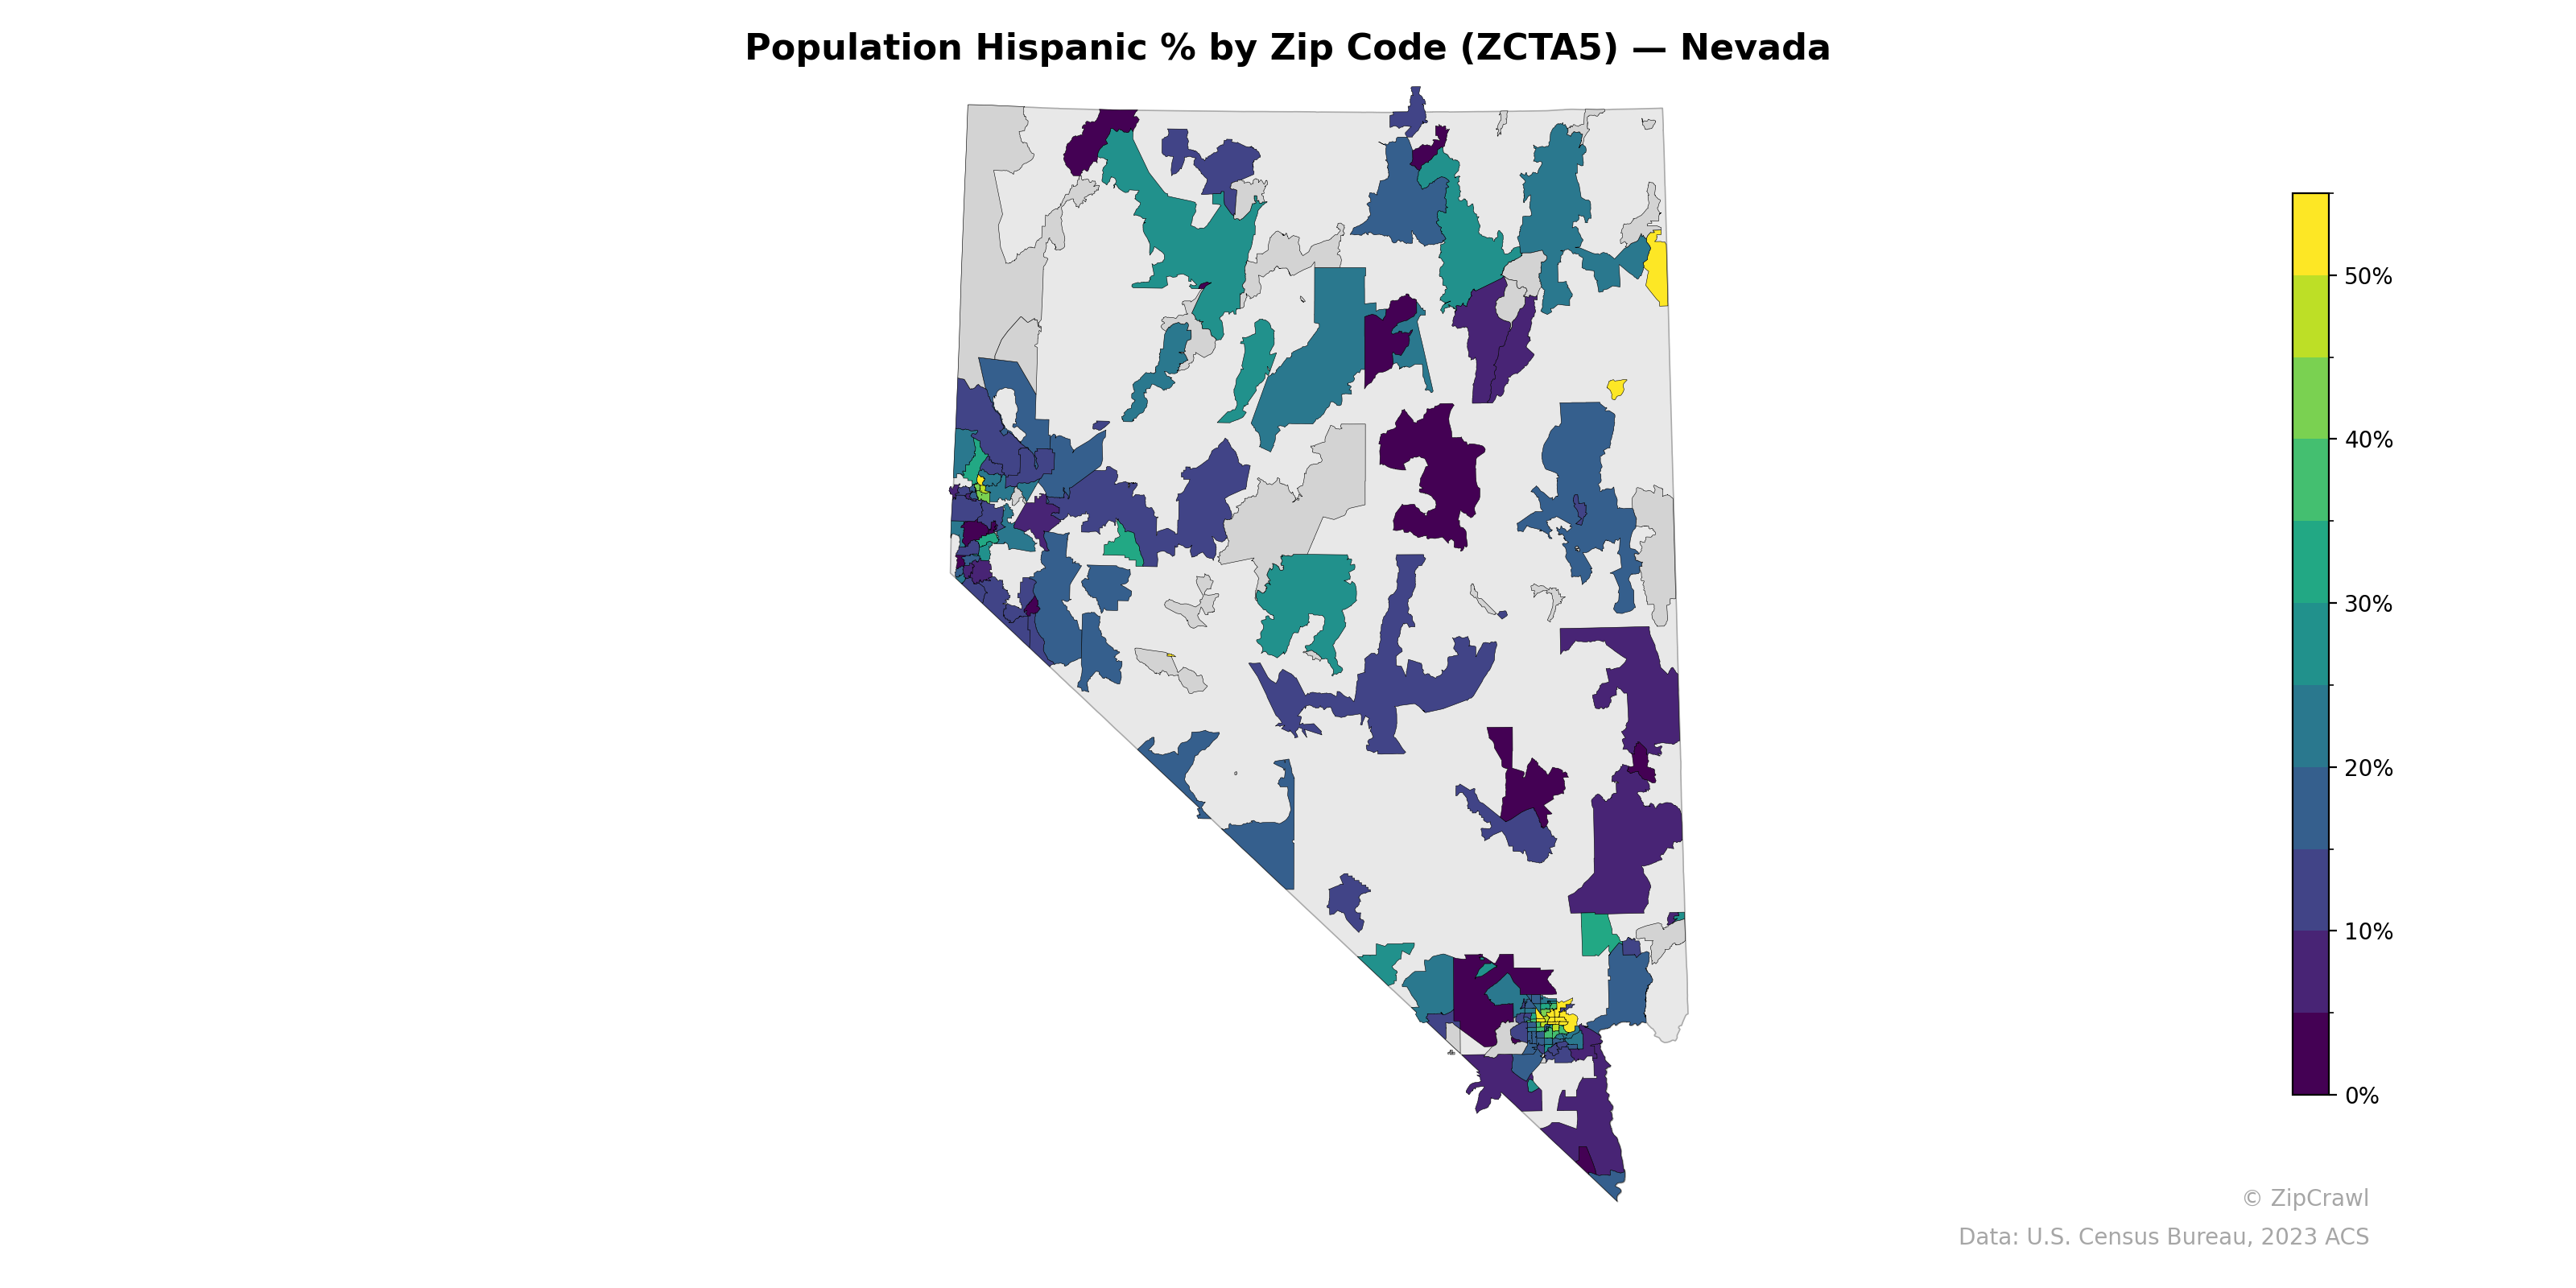
NOTE: Gray indicates insufficient data or a suppressed estimate.
The Las Vegas metropolitan area in southern Nevada displays the widest range of Hispanic population shares, with several zip codes exceeding 50% (shown in yellow and green) concentrated in the urban core, while adjacent suburban zip codes drop to under 10%. Northern Nevada's Reno-Sparks region along the western border shows a moderate Hispanic presence clustering around 20–35%, contrasting with the predominantly low-percentage rural zip codes across the state's vast interior. The highest Hispanic concentrations statewide align with urban centers and agricultural corridors, while remote rural areas in central and eastern Nevada consistently register among the lowest percentages.
Data: U.S. Census Bureau, 2023 ACS
Explore
- Population Non-Hispanic White % by Zip Code (ZCTA5) — Florida
- Population Non-Hispanic White % by Zip Code (ZCTA5) — Nevada
- Household Median Income by Zip Code (ZCTA5) — Nevada
- % of Population on Food Stamps or SNAP (Last 12 Months), by Zip Code (ZCTA5) — Iowa
- Population Non-Hispanic Black % by Zip Code (ZCTA5) — Nevada
- Median Age by Zip Code (ZCTA5) — Nevada
- Married Couple (% of all Households) by Zip Code (ZCTA5) — Iowa
- U.S. Citizens (% of Population Over 18) by Zip Code (ZCTA5) — Nevada
- Housing Vacancy Rate by Zip Code (ZCTA5) — Iowa
- Population Non-Hispanic Asian % by Zip Code (ZCTA5) — Iowa
- Housing Owner-Occupied Median Value ($), by County
- Married Couple (% of all Households) by Zip Code (ZCTA5) — Dallas Metro
- High School Graduate (% of Over 25) by Zip Code (ZCTA5) — Florida
- Married Couple (% of all Households) by Zip Code (ZCTA5) — New York
- Median Age by Zip Code (ZCTA5) — Florida
- Household Median Income by Zip Code (ZCTA5) — Florida
- Population Non-Hispanic Black % by Zip Code (ZCTA5) — Florida
- Population Non-Hispanic Asian % by Zip Code (ZCTA5) — California
- % of Population on Food Stamps or SNAP (Last 12 Months), by Zip Code (ZCTA5) — California
- U.S. Citizens (% of Population Over 18) by Zip Code (ZCTA5) — Florida
- Population Non-Hispanic American Indian % by Zip Code (ZCTA5) — Florida
- Married Couple (% of all Households) by Zip Code (ZCTA5) — Connecticut
- High School Graduate (% of Over 25) by Zip Code (ZCTA5) — Connecticut
- Housing Vacancy Rate by Zip Code (ZCTA5) — Connecticut
- Bachelor's Degree or Higher (% of Over 25) by Zip Code (ZCTA5) — Connecticut
- Housing % of Units Built Since 2010, by Zip Code (ZCTA5) — Connecticut
- Median Age by Zip Code (ZCTA5) — Iowa
- Household Median Income by Zip Code (ZCTA5) — Iowa
- Population Non-Hispanic American Indian % by Zip Code (ZCTA5) — Connecticut
- Housing Median Monthly Rent ($), by Zip Code (ZCTA5) — Nevada
- Population Hispanic % by Zip Code (ZCTA5) — New York
- Population Hispanic % by Zip Code (ZCTA5) — Nebraska
- Population Hispanic % by Zip Code (ZCTA5) — Utah
- Population Hispanic % by Zip Code (ZCTA5) — Iowa
- Population Hispanic % by Zip Code (ZCTA5) — Ohio
- Population Hispanic % by Zip Code (ZCTA5) — Florida
- Population Hispanic % by Zip Code (ZCTA5) — Texas
- Population Hispanic % by Zip Code (ZCTA5) — Hawaii
- Population Hispanic % by Zip Code (ZCTA5) — Oregon
- Population Hispanic % by Zip Code (ZCTA5) — Idaho