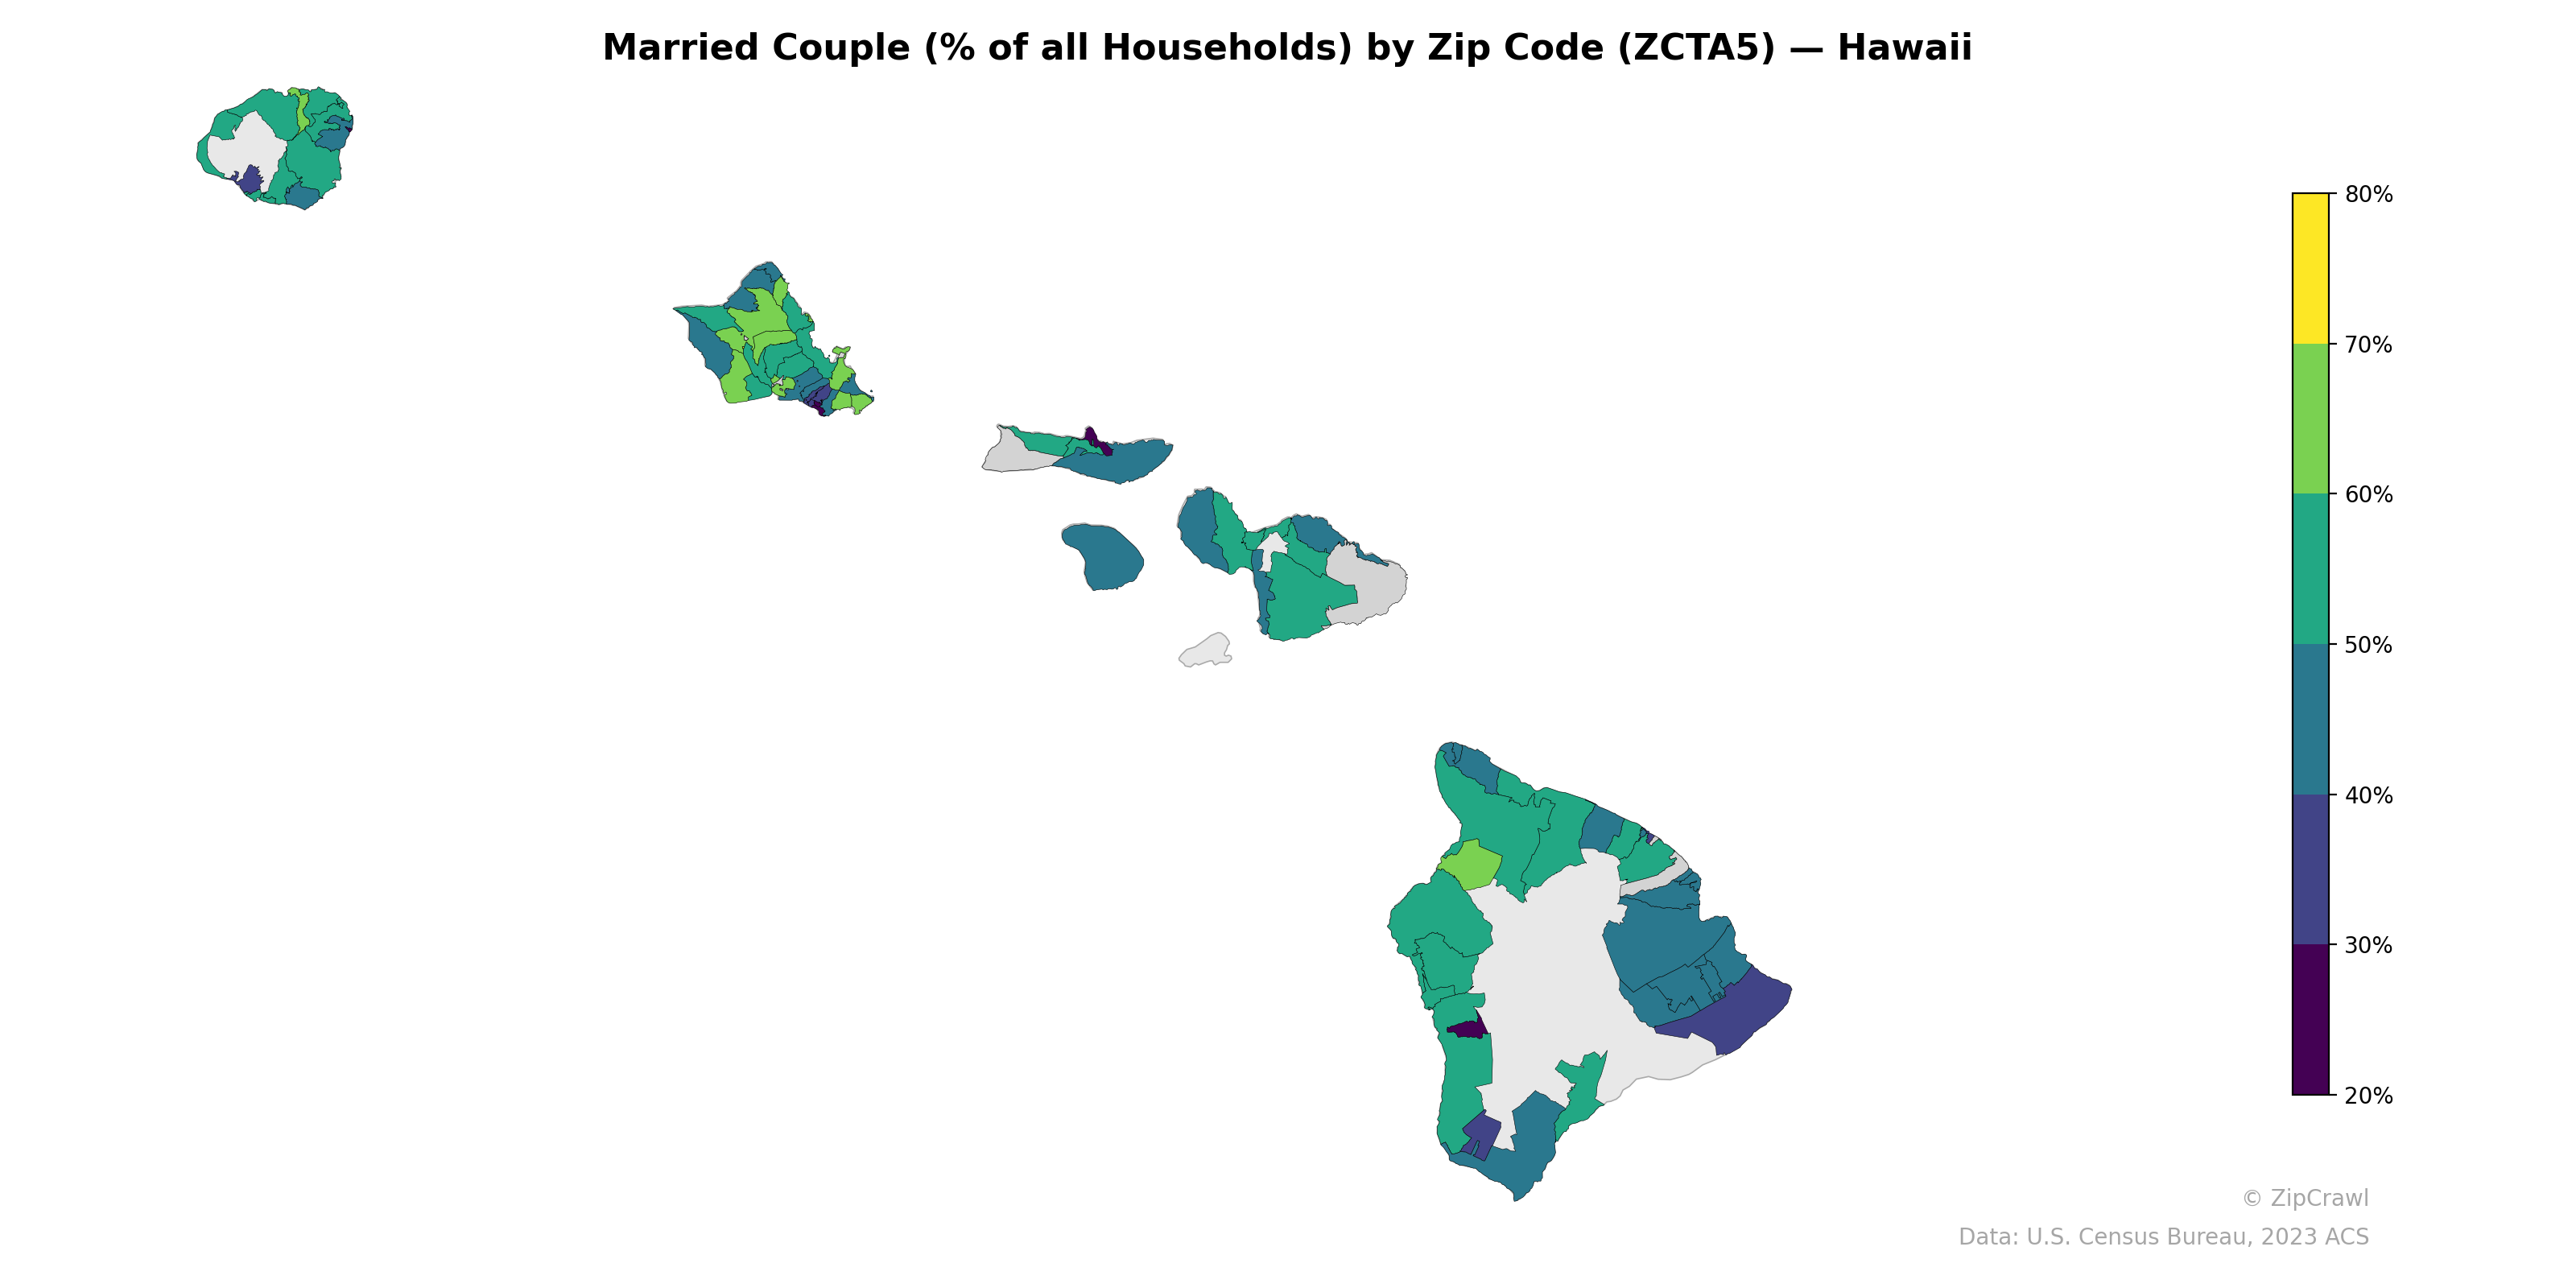
NOTE: Gray indicates insufficient data or a suppressed estimate.
Zip codes in rural and suburban areas of Oahu's North Shore and windward coast, as well as parts of Kauai and Maui, tend to display higher married-couple household percentages (60–80%), while urban Honolulu—particularly the Waikiki and downtown corridors—registers some of the lowest rates in the state, falling below 30%. The Big Island exhibits notable internal contrast, with coastal and resort-adjacent zip codes in South Kohala and North Kona showing moderate-to-high rates, while the Hilo area and southern tip trend lower. This urban-rural gradient is consistent across all major islands, suggesting that housing density and cost dynamics strongly correlate with household composition patterns statewide.
Data: U.S. Census Bureau, 2023 ACS
Explore
- Household Median Income by Zip Code (ZCTA5) — New York
- Population Non-Hispanic Black % by Zip Code (ZCTA5) — New Hampshire
- Population Non-Hispanic White % by Zip Code (ZCTA5) — New Hampshire
- % of Population on Food Stamps or SNAP (Last 12 Months), by Zip Code (ZCTA5) — Hawaii
- U.S. Citizens (% of Population Over 18) by Zip Code (ZCTA5) — New Hampshire
- Population Hispanic % by Zip Code (ZCTA5) — New Hampshire
- Housing Vacancy Rate by Zip Code (ZCTA5) — Hawaii
- Household Median Income by Zip Code (ZCTA5) — New Hampshire
- Median Age by Zip Code (ZCTA5) — New Hampshire
- Population Non-Hispanic Asian % by Zip Code (ZCTA5) — Hawaii
- U.S. Citizens by County (% of Population Over 18)
- Population Non-Hispanic Black % by Zip Code (ZCTA5) — New York
- High School Graduate (% of Over 25) by Zip Code (ZCTA5) — New York
- Population Non-Hispanic American Indian % by Zip Code (ZCTA5) — New York
- Bachelor's Degree or Higher (% of Over 25) by Zip Code (ZCTA5) — Phoenix Metro
- U.S. Citizens (% of Population Over 18) by Zip Code (ZCTA5) — New York
- % of Population on Food Stamps or SNAP (Last 12 Months), by Zip Code (ZCTA5) — Florida
- Median Age by Zip Code (ZCTA5) — New York
- Population Hispanic % by Zip Code (ZCTA5) — New York
- Population Non-Hispanic Asian % by Zip Code (ZCTA5) — Florida
- Bachelor's Degree or Higher (% of Over 25) by Zip Code (ZCTA5) — Florida
- Population Non-Hispanic White % by Zip Code (ZCTA5) — New York
- % of Households with Broadband Internet, by Zip Code (ZCTA5) — West Virginia
- High School Graduate (% of Over 25) by Zip Code (ZCTA5) — West Virginia
- Population Non-Hispanic Asian % by Zip Code (ZCTA5) — West Virginia
- Population Hispanic % by Zip Code (ZCTA5) — Hawaii
- % of Population without Health Insurance, by Zip Code (ZCTA5) — West Virginia
- Population Non-Hispanic American Indian % by Zip Code (ZCTA5) — West Virginia
- Bachelor's Degree or Higher (% of Over 25) by Zip Code (ZCTA5) — West Virginia
- Housing Vacancy Rate by Zip Code (ZCTA5) — West Virginia
- Married Couple (% of all Households) by Zip Code (ZCTA5) — Ohio
- Married Couple (% of all Households) by Zip Code (ZCTA5) — Maine
- Married Couple (% of all Households) by Zip Code (ZCTA5) — Iowa
- Married Couple (% of all Households) by Zip Code (ZCTA5) — Alaska
- Married Couple (% of all Households) by Zip Code (ZCTA5) — Utah
- Married Couple (% of all Households) by Zip Code (ZCTA5) — Alabama
- Married Couple (% of all Households) by Zip Code (ZCTA5) — Texas
- Married Couple (% of all Households) by Zip Code (ZCTA5) — Oregon
- Married Couple (% of all Households) by Zip Code (ZCTA5) — Maryland
- Married Couple (% of all Households) by Zip Code (ZCTA5) — Idaho