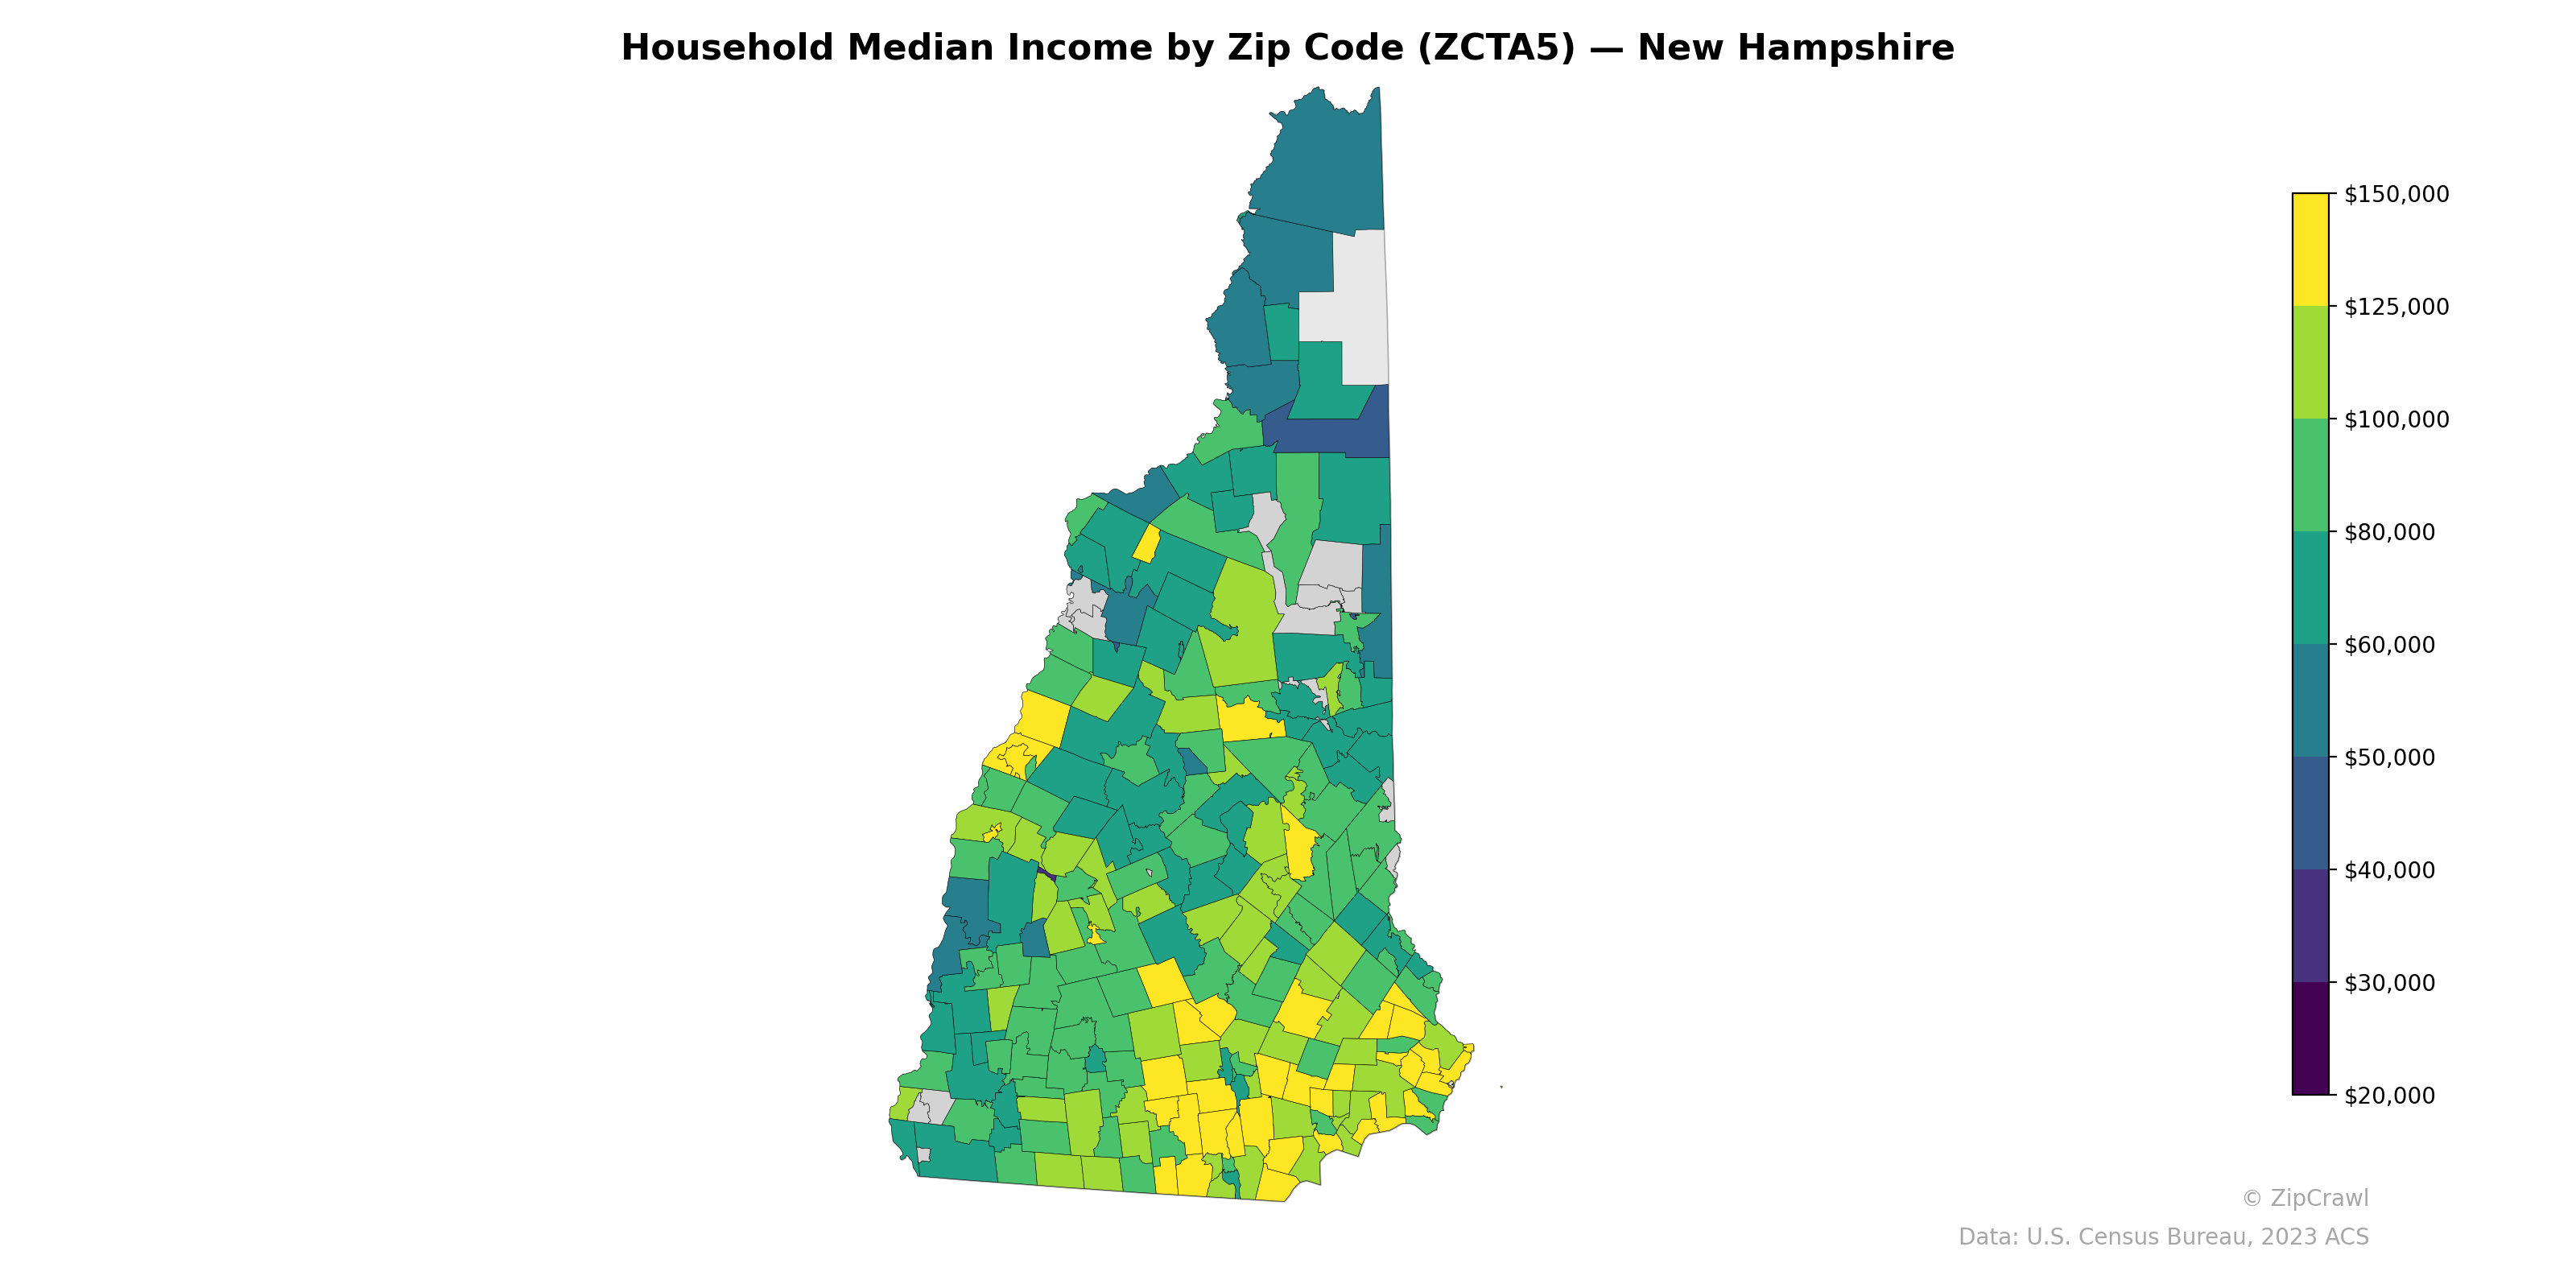
NOTE: Gray indicates insufficient data or a suppressed estimate.
The southern tier of New Hampshire, particularly the border communities closest to the Massachusetts labor market, displays the highest household median incomes, with several zip codes reaching $125,000–$150,000, reflecting the economic influence of the Boston commuter corridor. The far northern regions — especially the sparsely populated areas near the Canadian border and the upper Connecticut River valley — skew markedly lower, with pockets falling below $40,000, consistent with limited employment density and seasonal tourism-dependent economies. A notable mid-state contrast emerges around the Lakes Region and central highlands, where adjacent zip codes can vary by $30,000–$50,000, likely reflecting the difference between resort-adjacent wealth and more rural, working-class communities.
Data: U.S. Census Bureau, 2023 ACS
Explore
- Married Couple (% of all Households) by Zip Code (ZCTA5) — Hawaii
- Population Non-Hispanic Asian % by Zip Code (ZCTA5) — Hawaii
- Median Age by Zip Code (ZCTA5) — New Hampshire
- % of Population on Food Stamps or SNAP (Last 12 Months), by Zip Code (ZCTA5) — Hawaii
- Population Non-Hispanic Black % by Zip Code (ZCTA5) — New Hampshire
- Population Hispanic % by Zip Code (ZCTA5) — New Hampshire
- Population Non-Hispanic White % by Zip Code (ZCTA5) — New Hampshire
- U.S. Citizens (% of Population Over 18) by Zip Code (ZCTA5) — New Hampshire
- Housing Vacancy Rate by Zip Code (ZCTA5) — Hawaii
- U.S. Citizens by County (% of Population Over 18)
- Housing Median Monthly Rent ($), by Zip Code (ZCTA5) — Phoenix Metro
- Population Non-Hispanic American Indian % by Zip Code (ZCTA5) — New York
- High School Graduate (% of Over 25) by Zip Code (ZCTA5) — New York
- U.S. Citizens (% of Population Over 18) by Zip Code (ZCTA5) — New York
- Median Age by Zip Code (ZCTA5) — New York
- % of Population on Food Stamps or SNAP (Last 12 Months), by Zip Code (ZCTA5) — Florida
- Population Non-Hispanic White % by Zip Code (ZCTA5) — New York
- Population Hispanic % by Zip Code (ZCTA5) — New York
- Population Non-Hispanic Black % by Zip Code (ZCTA5) — New York
- Population Non-Hispanic Asian % by Zip Code (ZCTA5) — Florida
- Housing Median Monthly Rent ($), by Zip Code (ZCTA5) — Florida
- Population Non-Hispanic Asian % by Zip Code (ZCTA5) — West Virginia
- % of Population without Health Insurance, by Zip Code (ZCTA5) — West Virginia
- % of Population on Food Stamps or SNAP (Last 12 Months), by Zip Code (ZCTA5) — West Virginia
- Population Hispanic % by Zip Code (ZCTA5) — Hawaii
- Population Non-Hispanic American Indian % by Zip Code (ZCTA5) — West Virginia
- Bachelor's Degree or Higher (% of Over 25) by Zip Code (ZCTA5) — West Virginia
- High School Graduate (% of Over 25) by Zip Code (ZCTA5) — West Virginia
- % of Households with Broadband Internet, by Zip Code (ZCTA5) — West Virginia
- Housing Owner-Occupied % of Units, by Zip Code (ZCTA5) — West Virginia
- Household Median Income by Zip Code (ZCTA5) — New Mexico
- Household Median Income by Zip Code (ZCTA5) — New York
- Household Median Income by Zip Code (ZCTA5) — New Jersey
- Household Median Income by Zip Code (ZCTA5) — Nevada
- Household Median Income by Zip Code (ZCTA5) — New York Metro
- Household Median Income by Zip Code (ZCTA5) — Hawaii
- Household Median Income by Zip Code (ZCTA5) — Iowa
- Household Median Income by Zip Code (ZCTA5) — Indiana
- Household Median Income by Zip Code (ZCTA5) — Nebraska
- Household Median Income by Zip Code (ZCTA5) — Ohio