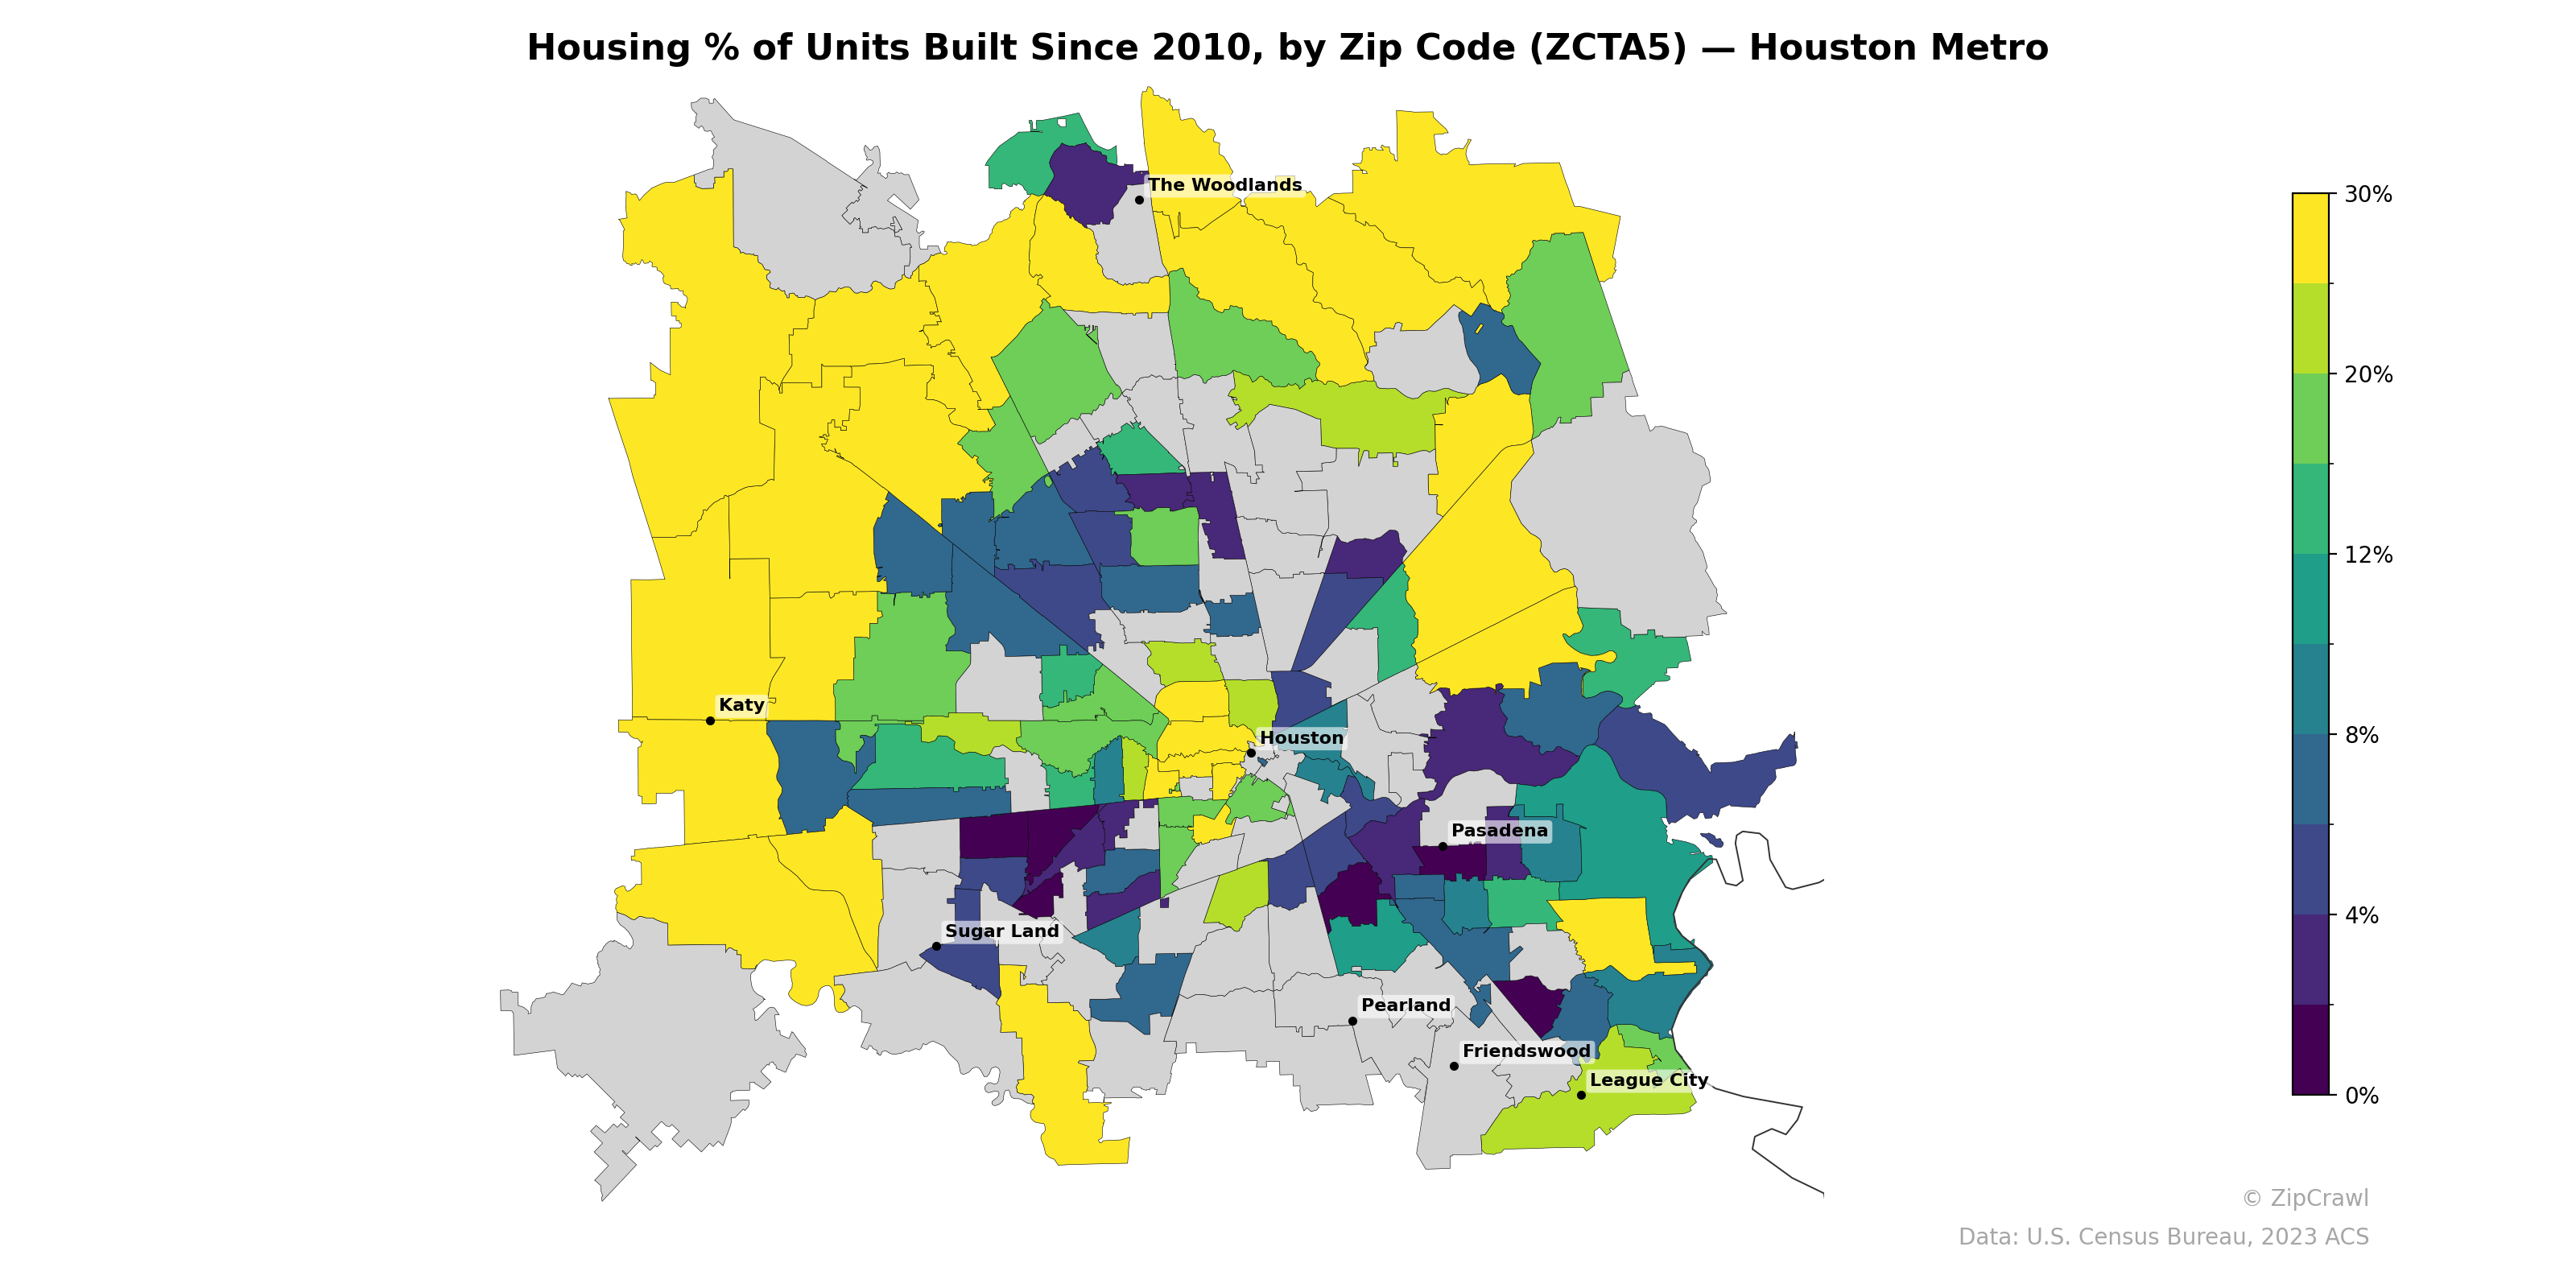
NOTE: Gray indicates insufficient data or a suppressed estimate.
The outer suburban ring of the Houston metro—particularly the large zip codes west of Katy, northwest toward The Woodlands, and in the far southwest—consistently registers the highest shares of post-2010 construction at 20–30%+, reflecting rapid greenfield development on the metropolitan fringe. In stark contrast, the urban core surrounding downtown Houston and the inner-loop neighborhoods display some of the lowest percentages (under 4%), indicative of an already built-out housing stock with limited new unit additions. Notable pockets of moderate new construction (8–15%) appear in transitional areas such as Pearland, portions of Sugar Land, and select corridors between the inner city and outer suburbs, suggesting infill and redevelopment activity in maturing suburban communities.
Data: U.S. Census Bureau, 2023 ACS
Explore
- Population Non-Hispanic American Indian % by Zip Code (ZCTA5) — New York Metro
- Housing Vacancy Rate by Zip Code (ZCTA5) — Houston Metro
- Bachelor's Degree or Higher (% of Over 25) by Zip Code (ZCTA5) — Houston Metro
- Housing Owner-Occupied % of Units, by Zip Code (ZCTA5) — Houston Metro
- Married Couple (% of all Households) by Zip Code (ZCTA5) — Houston Metro
- Household Average Size by Zip Code (ZCTA5) — Houston Metro
- Housing Owner-Occupied Median Value ($), by Zip Code (ZCTA5) — Houston Metro
- % of Households with Broadband Internet, by Zip Code (ZCTA5) — Houston Metro
- Housing Median Monthly Rent ($), by Zip Code (ZCTA5) — Houston Metro
- % of Population without Health Insurance, by Zip Code (ZCTA5) — Houston Metro
- Median Age by Zip Code (ZCTA5) — Arkansas
- Median Age by County
- U.S. Citizens (% of Population Over 18) by Zip Code (ZCTA5) — New York Metro
- Population Hispanic % by Zip Code (ZCTA5) — New York Metro
- Population Non-Hispanic White % by Zip Code (ZCTA5) — New York Metro
- High School Graduate (% of Over 25) by Zip Code (ZCTA5) — New York Metro
- % of Population on Food Stamps or SNAP (Last 12 Months), by County
- Median Age by Zip Code (ZCTA5) — New York Metro
- Population Non-Hispanic Black % by Zip Code (ZCTA5) — New York Metro
- Bachelor's Degree or Higher (% of Over 25) by Zip Code (ZCTA5) — New York Metro
- Household Median Income by Zip Code (ZCTA5) — New York Metro
- % of Population without Health Insurance, by Zip Code (ZCTA5) — Ohio
- Bachelor's Degree or Higher (% of Over 25) by Zip Code (ZCTA5) — Ohio
- Housing Owner-Occupied % of Units, by Zip Code (ZCTA5) — Ohio
- Population Non-Hispanic White % by Zip Code (ZCTA5) — Ohio
- Median Age by Zip Code (ZCTA5) — Ohio
- Population Non-Hispanic American Indian % by Zip Code (ZCTA5) — Ohio
- High School Graduate (% of Over 25) by Zip Code (ZCTA5) — Ohio
- % of Households with Broadband Internet, by Zip Code (ZCTA5) — Ohio
- Population Hispanic % by Zip Code (ZCTA5) — Ohio
- Housing % of Units Built Since 2010, by Zip Code (ZCTA5) — Boston Metro
- Housing % of Units Built Since 2010, by Zip Code (ZCTA5) — Austin Metro
- Housing % of Units Built Since 2010, by Zip Code (ZCTA5) — Miami Metro
- Housing % of Units Built Since 2010, by Zip Code (ZCTA5) — Tampa Metro
- Housing % of Units Built Since 2010, by Zip Code (ZCTA5) — Detroit Metro
- Housing % of Units Built Since 2010, by Zip Code (ZCTA5) — Seattle Metro
- Housing % of Units Built Since 2010, by Zip Code (ZCTA5) — Denver Metro
- Housing % of Units Built Since 2010, by Zip Code (ZCTA5) — Dallas Metro
- Housing % of Units Built Since 2010, by Zip Code (ZCTA5) — Chicago Metro
- Housing % of Units Built Since 2010, by Zip Code (ZCTA5) — Orlando Metro