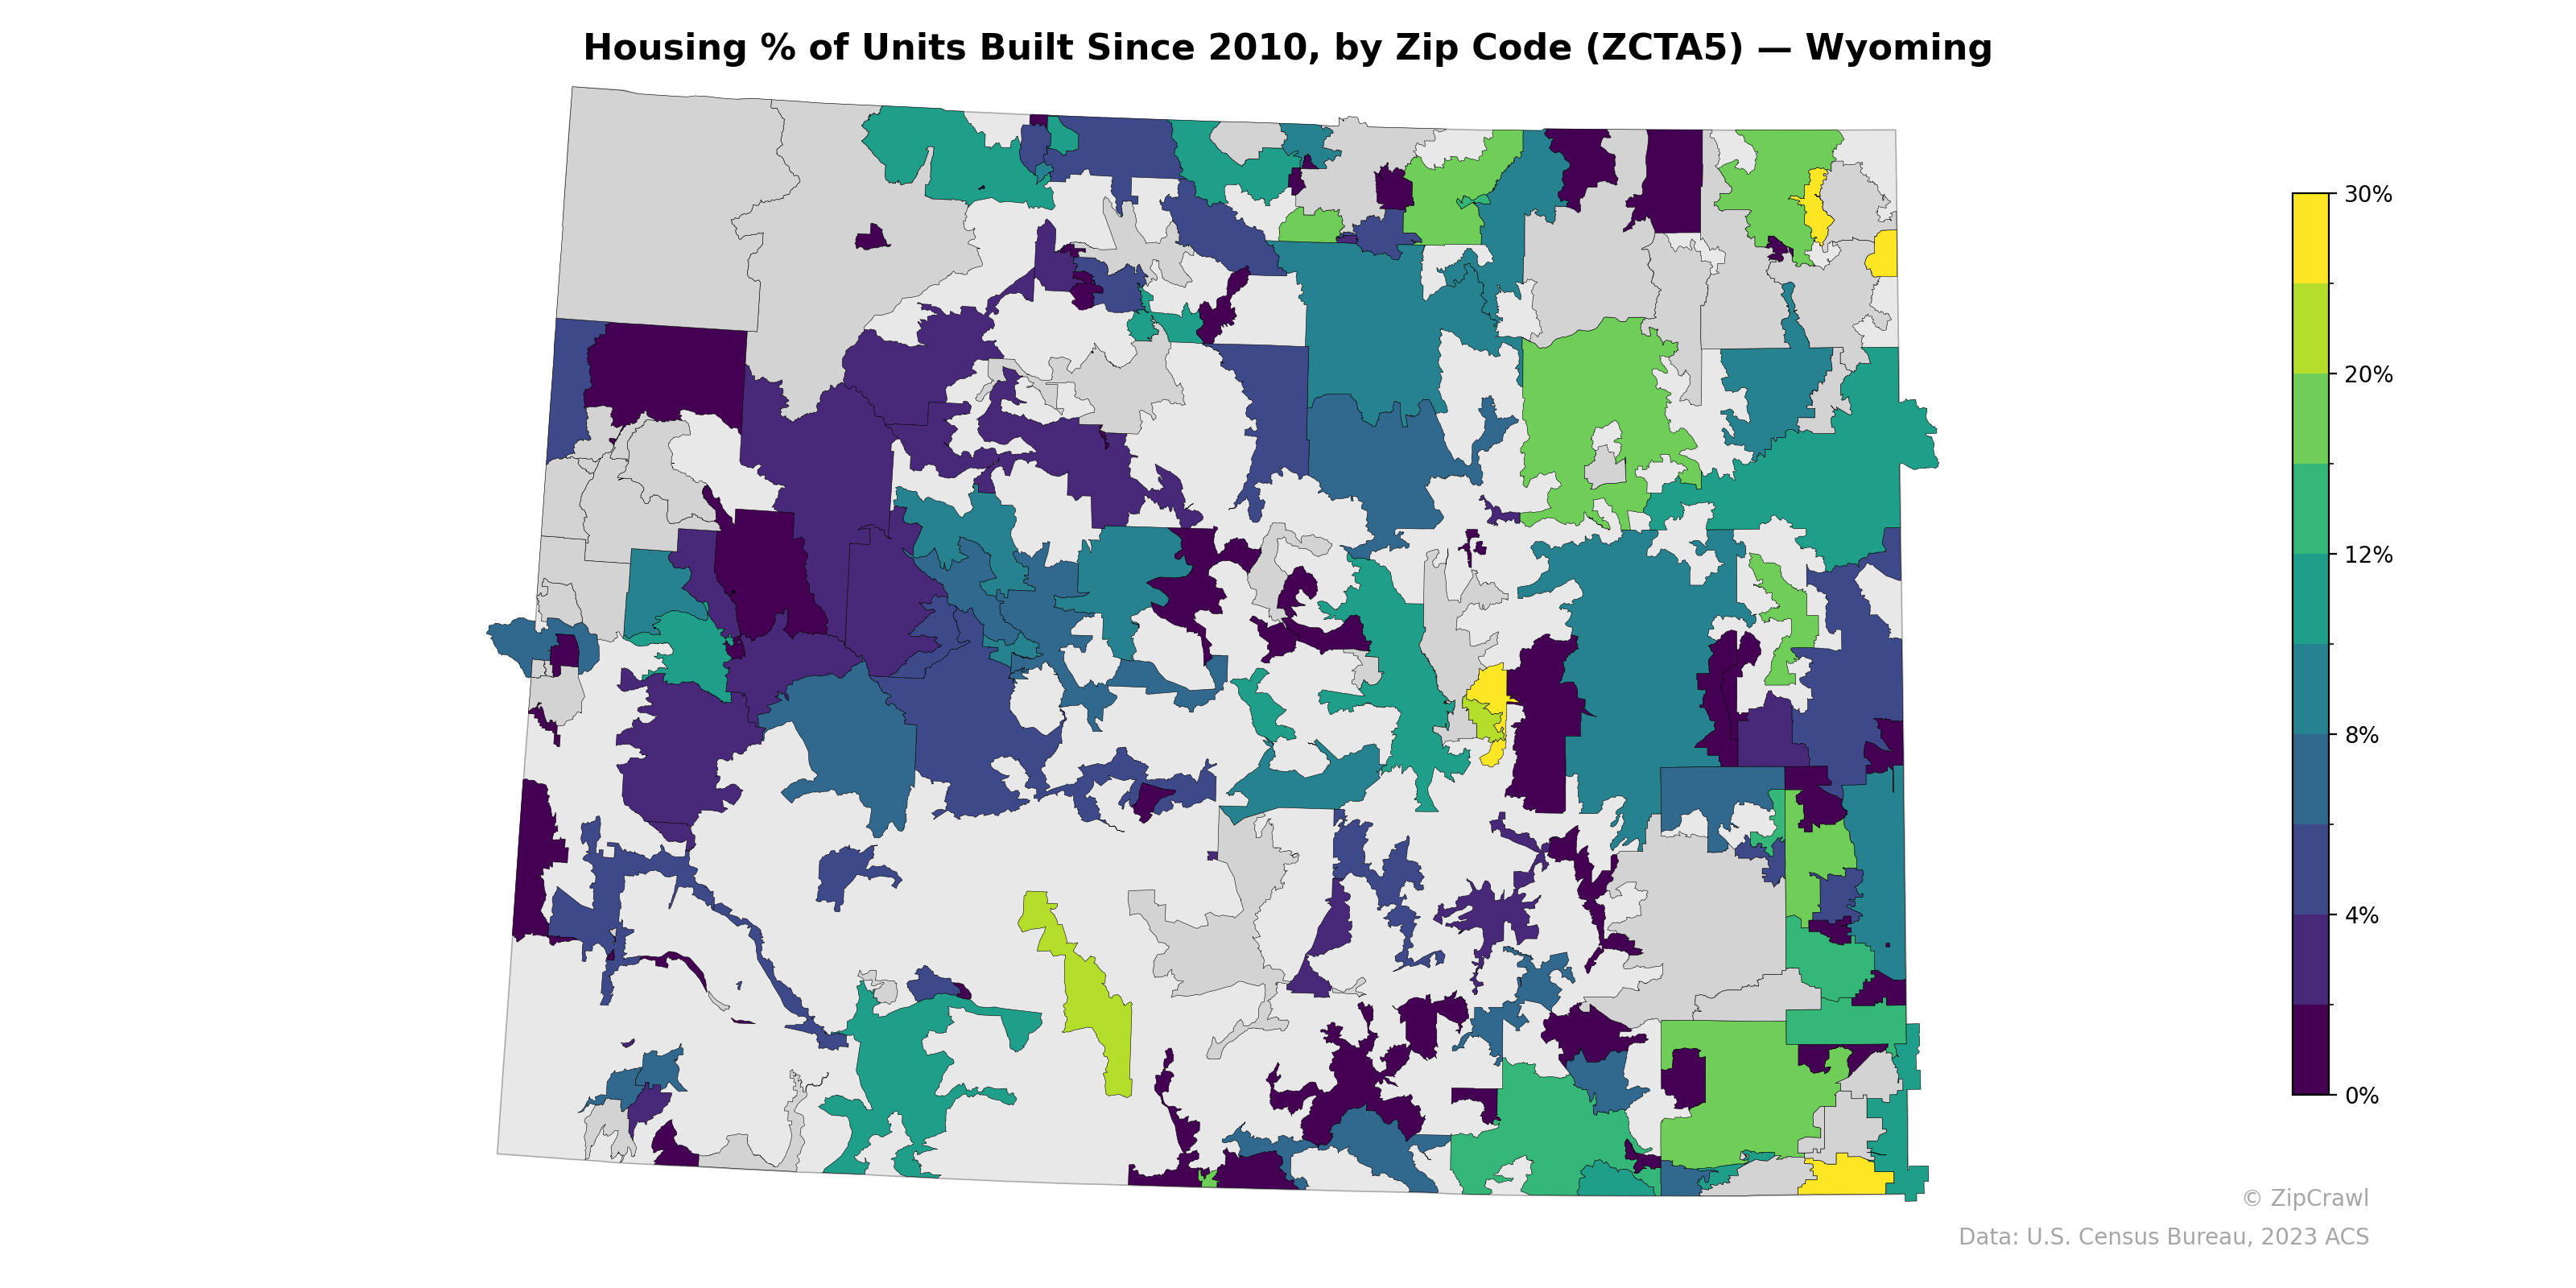
NOTE: Gray indicates insufficient data or a suppressed estimate.
Northeastern Wyoming zip codes, particularly in the Sheridan and Gillette areas, display notably higher percentages of housing units built since 2010, with several zones reaching 15–20% or above, reflecting energy-sector and amenity-driven growth. In contrast, much of central and southwestern Wyoming shows consistently low construction activity, with many zip codes falling below 4%, suggesting stagnant or declining housing demand in more rural and remote areas. A few isolated bright spots—such as a yellow-shaded zip code near the central-eastern part of the state—stand out as localized pockets of recent development amid otherwise subdued building trends.
Data: U.S. Census Bureau, 2023 ACS
Explore
- U.S. Citizens (% of Population Over 18) by Zip Code (ZCTA5) — Illinois
- Bachelor's Degree or Higher (% of Over 25) by Zip Code (ZCTA5) — Wyoming
- % of Population without Health Insurance, by Zip Code (ZCTA5) — Wyoming
- High School Graduate (% of Over 25) by Zip Code (ZCTA5) — Wyoming
- Housing Median Monthly Rent ($), by Zip Code (ZCTA5) — Wyoming
- Household Average Size by Zip Code (ZCTA5) — Wyoming
- Population Non-Hispanic American Indian % by Zip Code (ZCTA5) — Wyoming
- % of Households with Broadband Internet, by Zip Code (ZCTA5) — Wyoming
- Housing Owner-Occupied Median Value ($), by Zip Code (ZCTA5) — Wyoming
- Housing Owner-Occupied % of Units, by Zip Code (ZCTA5) — Wyoming
- Married Couple (% of all Households) by County
- Population Non-Hispanic Black % by Zip Code (ZCTA5) — Illinois
- Population Non-Hispanic American Indian % by Zip Code (ZCTA5) — Illinois
- High School Graduate (% of Over 25) by Zip Code (ZCTA5) — Illinois
- Population Hispanic % by Zip Code (ZCTA5) — Illinois
- Median Age by Zip Code (ZCTA5) — Illinois
- Population Non-Hispanic American Indian % by Zip Code (ZCTA5) — San Francisco Metro
- Population Non-Hispanic American Indian % by Zip Code (ZCTA5) — Florida
- Population Non-Hispanic White % by Zip Code (ZCTA5) — Illinois
- Population Non-Hispanic Asian % by Zip Code (ZCTA5) — New York
- % of Population on Food Stamps or SNAP (Last 12 Months), by Zip Code (ZCTA5) — New York
- Household Median Income by Zip Code (ZCTA5) — Illinois
- Housing Vacancy Rate by Zip Code (ZCTA5) — Vermont
- Bachelor's Degree or Higher (% of Over 25) by Zip Code (ZCTA5) — Vermont
- Population Non-Hispanic Asian % by Zip Code (ZCTA5) — Vermont
- % of Households with Broadband Internet, by Zip Code (ZCTA5) — Vermont
- High School Graduate (% of Over 25) by Zip Code (ZCTA5) — Vermont
- Bachelor's Degree or Higher (% of Over 25) by Zip Code (ZCTA5) — Oregon
- Population Non-Hispanic American Indian % by Zip Code (ZCTA5) — Vermont
- Population Hispanic % by Zip Code (ZCTA5) — Washington D.C.
- Housing % of Units Built Since 2010, by Zip Code (ZCTA5) — Ohio
- Housing % of Units Built Since 2010, by Zip Code (ZCTA5) — Utah
- Housing % of Units Built Since 2010, by Zip Code (ZCTA5) — Iowa
- Housing % of Units Built Since 2010, by Zip Code (ZCTA5) — Maine
- Housing % of Units Built Since 2010, by Zip Code (ZCTA5) — Idaho
- Housing % of Units Built Since 2010, by Zip Code (ZCTA5) — Hawaii
- Housing % of Units Built Since 2010, by Zip Code (ZCTA5) — Texas
- Housing % of Units Built Since 2010, by Zip Code (ZCTA5) — Oregon
- Housing % of Units Built Since 2010, by Zip Code (ZCTA5) — Wisconsin
- Housing % of Units Built Since 2010, by Zip Code (ZCTA5) — Colorado