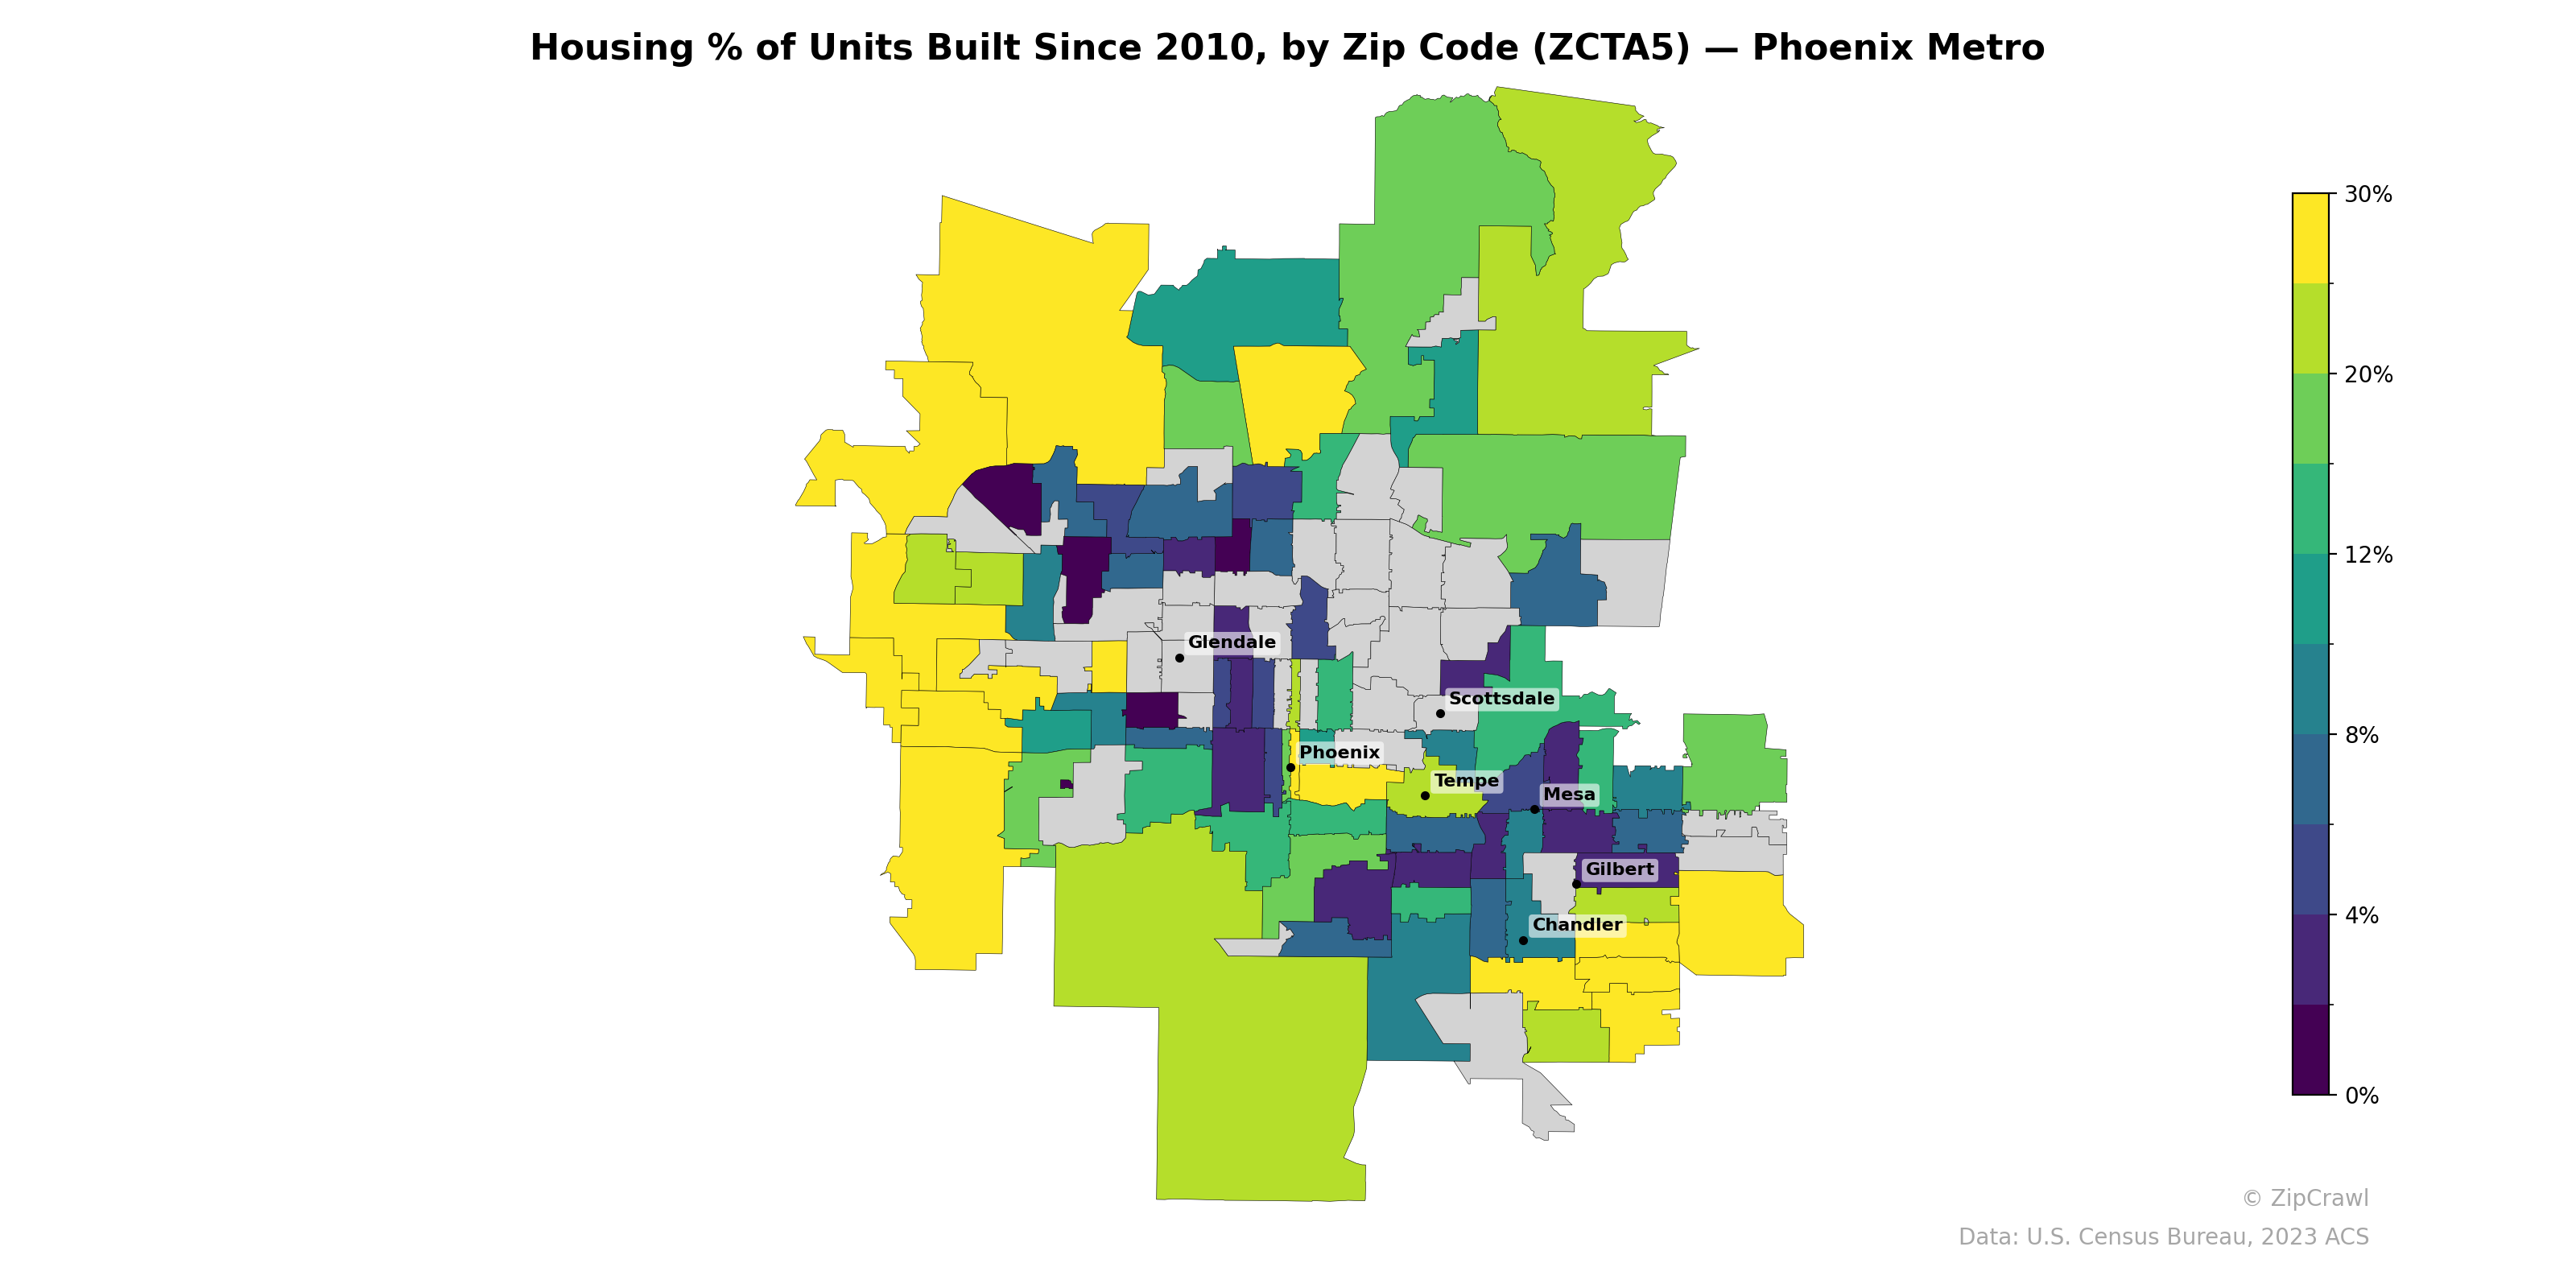
NOTE: Gray indicates insufficient data or a suppressed estimate.
The outer periphery of the Phoenix metro—particularly the far west, southwest, and far north—exhibits the highest concentrations of post-2010 housing construction, with many zip codes exceeding 20–30%, reflecting the rapid outward suburban expansion characteristic of Sun Belt growth patterns. In sharp contrast, the urban core areas around central Phoenix, Tempe, and older portions of Scottsdale and Mesa display notably low percentages (often below 4%), indicating mature, built-out neighborhoods with limited new residential development. Gilbert and Chandler present an interesting mixed pattern, with some zip codes showing very recent construction activity adjacent to others with minimal new building, suggesting uneven infill and remaining pockets of developable land.
Data: U.S. Census Bureau, 2023 ACS
Explore
- Household Median Income by Zip Code (ZCTA5) — Los Angeles Metro
- Housing Median Monthly Rent ($), by Zip Code (ZCTA5) — Phoenix Metro
- % of Households with Broadband Internet, by Zip Code (ZCTA5) — Phoenix Metro
- Bachelor's Degree or Higher (% of Over 25) by Zip Code (ZCTA5) — Phoenix Metro
- Household Average Size by Zip Code (ZCTA5) — Phoenix Metro
- Housing Vacancy Rate by Zip Code (ZCTA5) — Phoenix Metro
- Housing Owner-Occupied Median Value ($), by Zip Code (ZCTA5) — Phoenix Metro
- % of Population without Health Insurance, by Zip Code (ZCTA5) — Phoenix Metro
- Housing Owner-Occupied % of Units, by Zip Code (ZCTA5) — Phoenix Metro
- Married Couple (% of all Households) by Zip Code (ZCTA5) — Phoenix Metro
- Median Age by Zip Code (ZCTA5) — New Hampshire
- Population Hispanic % by County
- High School Graduate (% of Over 25) by Zip Code (ZCTA5) — Los Angeles Metro
- Population Non-Hispanic American Indian % by Zip Code (ZCTA5) — Los Angeles Metro
- Median Age by Zip Code (ZCTA5) — Los Angeles Metro
- Population Hispanic % by Zip Code (ZCTA5) — Los Angeles Metro
- Household Average Size by Zip Code (ZCTA5) — New York Metro
- Population Non-Hispanic Black % by Zip Code (ZCTA5) — Los Angeles Metro
- % of Population on Food Stamps or SNAP (Last 12 Months), by Zip Code (ZCTA5) — New York Metro
- Population Non-Hispanic White % by Zip Code (ZCTA5) — Los Angeles Metro
- U.S. Citizens (% of Population Over 18) by Zip Code (ZCTA5) — Los Angeles Metro
- Household Average Size by Zip Code (ZCTA5) — Virginia
- Housing Owner-Occupied Median Value ($), by Zip Code (ZCTA5) — Virginia
- Married Couple (% of all Households) by Zip Code (ZCTA5) — Virginia
- High School Graduate (% of Over 25) by Zip Code (ZCTA5) — Virginia
- Population Non-Hispanic American Indian % by Zip Code (ZCTA5) — Virginia
- % of Population without Health Insurance, by Zip Code (ZCTA5) — Virginia
- Housing Owner-Occupied % of Units, by Zip Code (ZCTA5) — Virginia
- Housing Median Monthly Rent ($), by Zip Code (ZCTA5) — Virginia
- Bachelor's Degree or Higher (% of Over 25) by Zip Code (ZCTA5) — Virginia
- Housing % of Units Built Since 2010, by Zip Code (ZCTA5) — Houston Metro
- Housing % of Units Built Since 2010, by Zip Code (ZCTA5) — Miami Metro
- Housing % of Units Built Since 2010, by Zip Code (ZCTA5) — Detroit Metro
- Housing % of Units Built Since 2010, by Zip Code (ZCTA5) — Boston Metro
- Housing % of Units Built Since 2010, by Zip Code (ZCTA5) — Tampa Metro
- Housing % of Units Built Since 2010, by Zip Code (ZCTA5) — Portland Metro
- Housing % of Units Built Since 2010, by Zip Code (ZCTA5) — Seattle Metro
- Housing % of Units Built Since 2010, by Zip Code (ZCTA5) — Chicago Metro
- Housing % of Units Built Since 2010, by Zip Code (ZCTA5) — Denver Metro
- Housing % of Units Built Since 2010, by Zip Code (ZCTA5) — Dallas Metro