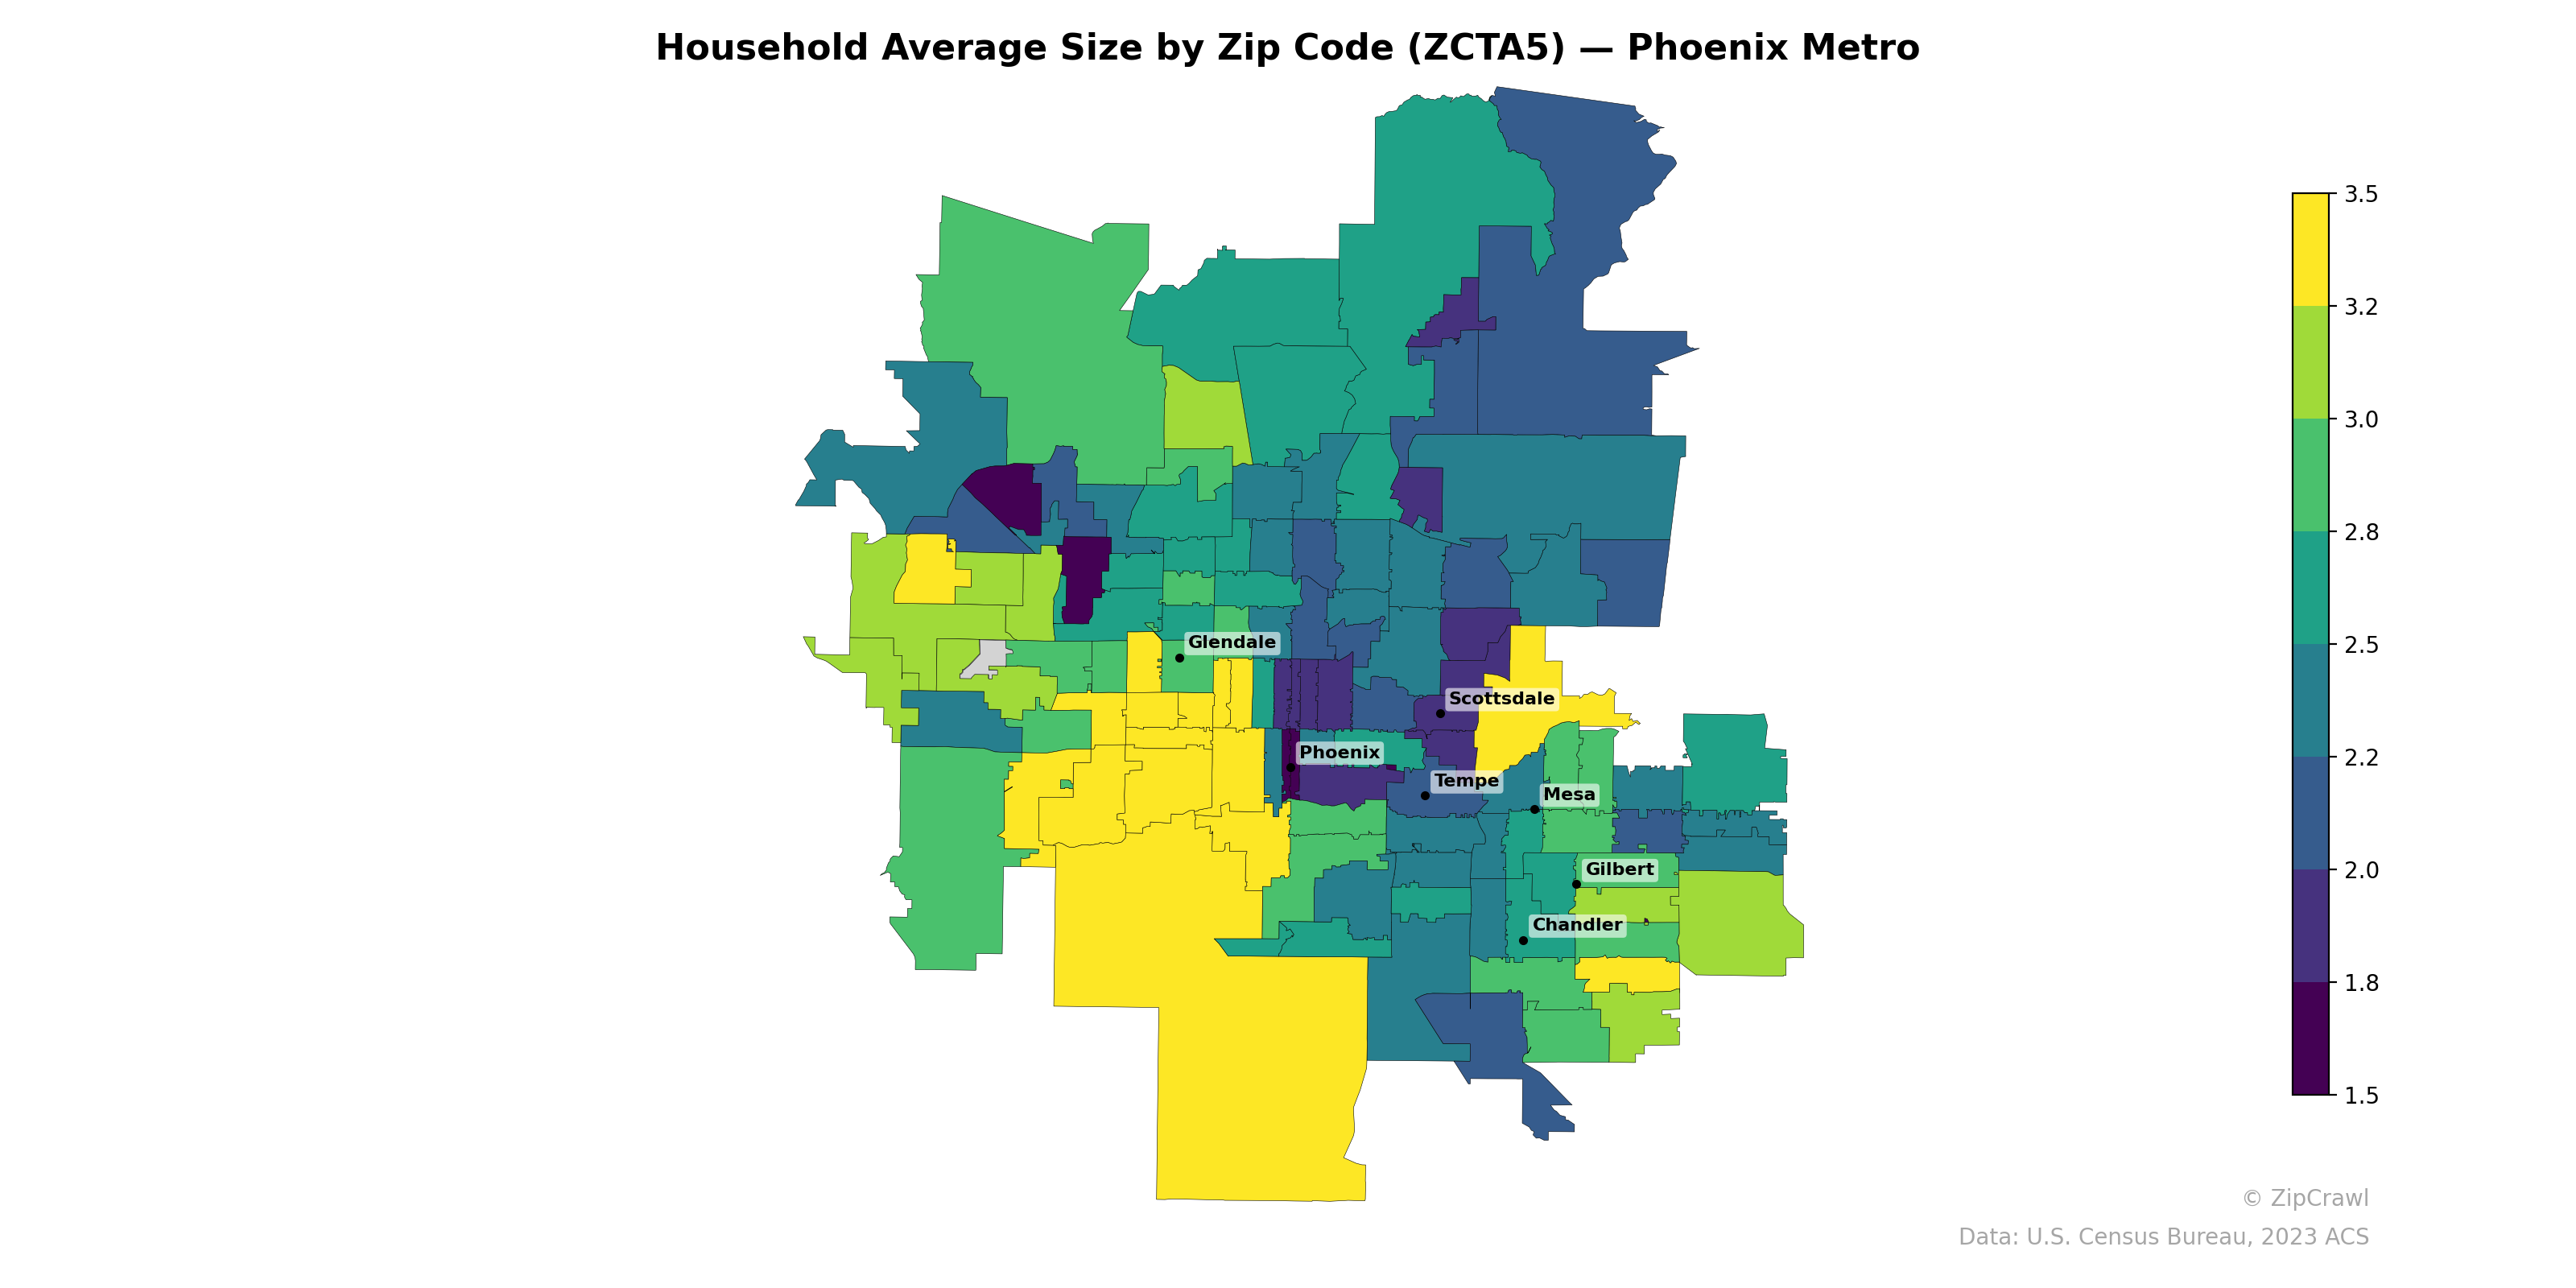
NOTE: Gray indicates insufficient data or a suppressed estimate.
Household sizes in the Phoenix metro follow a clear core-periphery pattern, with the smallest averages (1.5–2.0) concentrated in downtown Phoenix, Tempe, and central Scottsdale—areas with higher shares of apartments, student housing, and single-occupant units—while the southern and southeastern suburbs around Gilbert, Chandler, and Queen Creek display the largest households (3.0–3.5+), consistent with newer family-oriented subdivisions. The western fringe near Glendale and Buckeye shows notable variability, with pockets of yellow (3.0+) interspersed among moderate-sized household zones, suggesting a mix of established communities and rapidly growing family developments. Northern zip codes trending toward Cave Creek and Carefree generally fall in the 2.4–2.8 range, reflecting a blend of retirement-age and mid-career households on larger-lot properties.
Data: U.S. Census Bureau, 2023 ACS
Explore
- Household Median Income by Zip Code (ZCTA5) — Los Angeles Metro
- Housing Median Monthly Rent ($), by Zip Code (ZCTA5) — Phoenix Metro
- % of Households with Broadband Internet, by Zip Code (ZCTA5) — Phoenix Metro
- Bachelor's Degree or Higher (% of Over 25) by Zip Code (ZCTA5) — Phoenix Metro
- Housing % of Units Built Since 2010, by Zip Code (ZCTA5) — Phoenix Metro
- Housing Vacancy Rate by Zip Code (ZCTA5) — Phoenix Metro
- Housing Owner-Occupied Median Value ($), by Zip Code (ZCTA5) — Phoenix Metro
- % of Population without Health Insurance, by Zip Code (ZCTA5) — Phoenix Metro
- Housing Owner-Occupied % of Units, by Zip Code (ZCTA5) — Phoenix Metro
- Married Couple (% of all Households) by Zip Code (ZCTA5) — Phoenix Metro
- Population Non-Hispanic White % by Zip Code (ZCTA5) — New Hampshire
- Population Hispanic % by County
- High School Graduate (% of Over 25) by Zip Code (ZCTA5) — Los Angeles Metro
- Population Non-Hispanic American Indian % by Zip Code (ZCTA5) — Los Angeles Metro
- Median Age by Zip Code (ZCTA5) — Los Angeles Metro
- Population Hispanic % by Zip Code (ZCTA5) — Los Angeles Metro
- Married Couple (% of all Households) by Zip Code (ZCTA5) — New York Metro
- Population Non-Hispanic Black % by Zip Code (ZCTA5) — Los Angeles Metro
- % of Population on Food Stamps or SNAP (Last 12 Months), by Zip Code (ZCTA5) — New York Metro
- Population Non-Hispanic White % by Zip Code (ZCTA5) — Los Angeles Metro
- U.S. Citizens (% of Population Over 18) by Zip Code (ZCTA5) — Los Angeles Metro
- Housing % of Units Built Since 2010, by Zip Code (ZCTA5) — Virginia
- Housing Owner-Occupied Median Value ($), by Zip Code (ZCTA5) — Virginia
- Married Couple (% of all Households) by Zip Code (ZCTA5) — Virginia
- High School Graduate (% of Over 25) by Zip Code (ZCTA5) — Virginia
- Population Non-Hispanic American Indian % by Zip Code (ZCTA5) — Virginia
- % of Population without Health Insurance, by Zip Code (ZCTA5) — Virginia
- Housing Owner-Occupied % of Units, by Zip Code (ZCTA5) — Virginia
- Housing Median Monthly Rent ($), by Zip Code (ZCTA5) — Virginia
- Bachelor's Degree or Higher (% of Over 25) by Zip Code (ZCTA5) — Virginia
- Household Average Size by Zip Code (ZCTA5) — Houston Metro
- Household Average Size by Zip Code (ZCTA5) — Miami Metro
- Household Average Size by Zip Code (ZCTA5) — Boston Metro
- Household Average Size by Zip Code (ZCTA5) — Austin Metro
- Household Average Size by Zip Code (ZCTA5) — Detroit Metro
- Household Average Size by Zip Code (ZCTA5) — Denver Metro
- Household Average Size by Zip Code (ZCTA5) — Tampa Metro
- Household Average Size by Zip Code (ZCTA5) — Portland Metro
- Household Average Size by Zip Code (ZCTA5) — Chicago Metro
- Household Average Size by Zip Code (ZCTA5) — Atlanta Metro