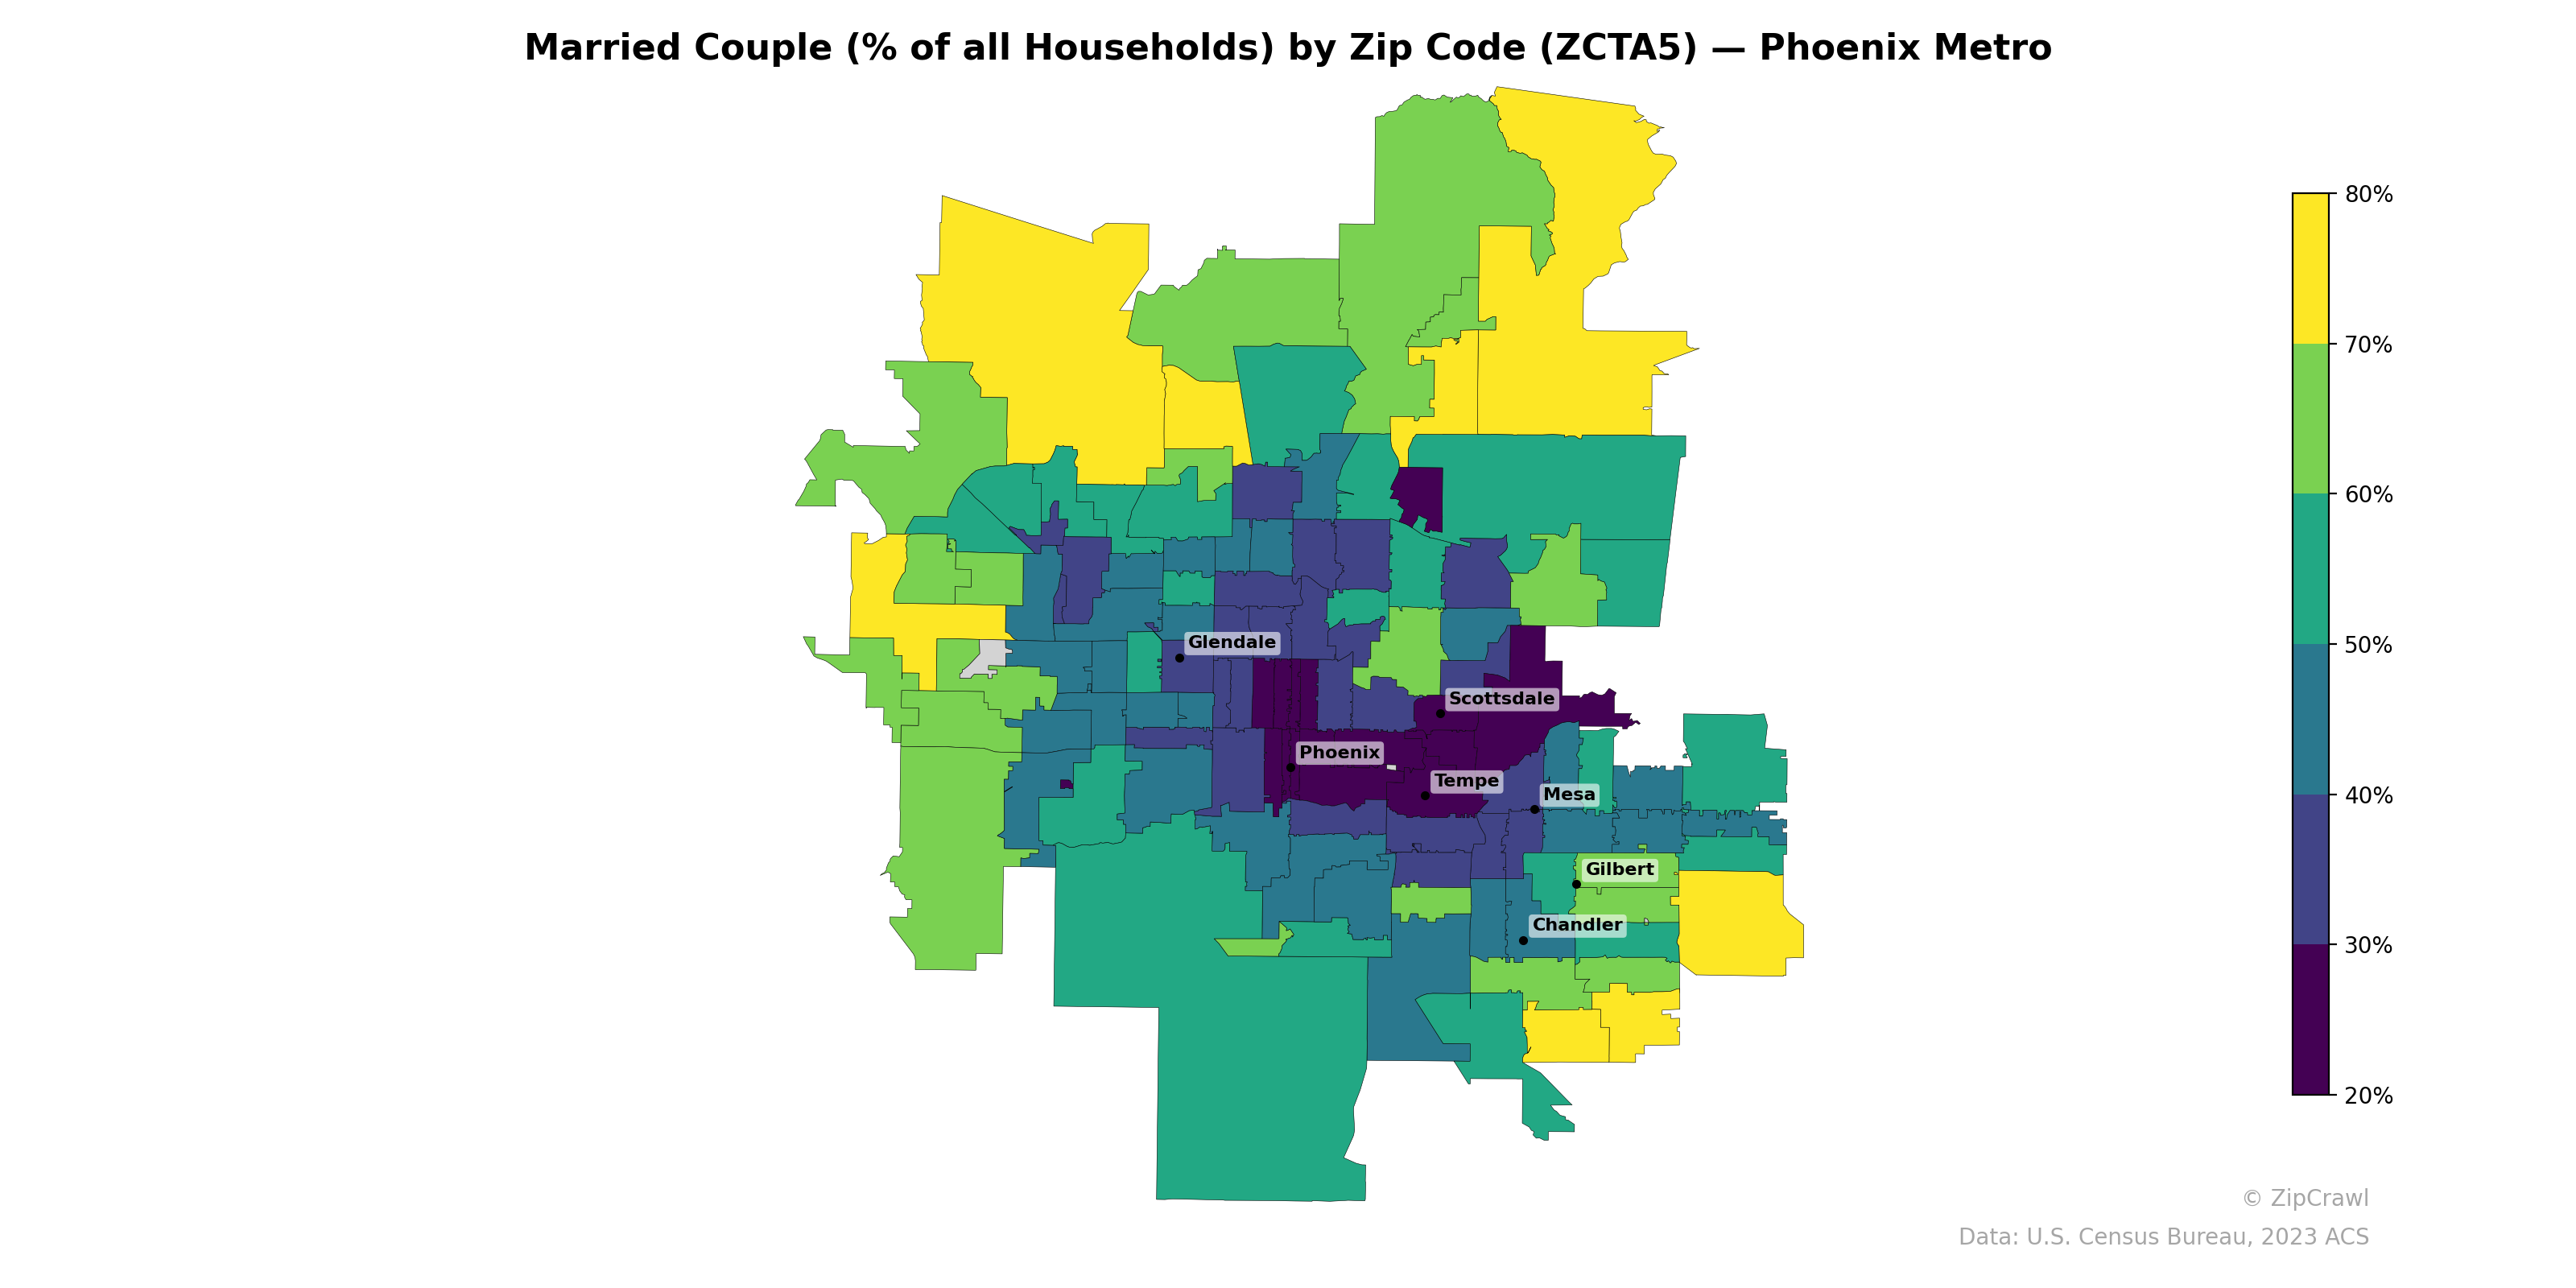
NOTE: Gray indicates insufficient data or a suppressed estimate.
Married-couple households concentrate most heavily in the outer suburban ring, with zip codes in north Scottsdale, the far northwest (Surprise/Peoria corridor), and the southeast Gilbert/Queen Creek area routinely exceeding 70%, while central Phoenix and Tempe zip codes fall well below 30%, reflecting higher shares of single-person and non-family households near the urban core and university district. A sharp gradient is visible moving outward from downtown Phoenix in nearly every direction, with the transition from sub-30% to above-60% often occurring within just a few adjacent zip codes. Scottsdale displays notable internal variation, with its southern zip codes near Old Town registering markedly lower married-couple shares than its affluent northern reaches.
Data: U.S. Census Bureau, 2023 ACS
Explore
- Household Median Income by Zip Code (ZCTA5) — Los Angeles Metro
- Housing Median Monthly Rent ($), by Zip Code (ZCTA5) — Phoenix Metro
- % of Households with Broadband Internet, by Zip Code (ZCTA5) — Phoenix Metro
- Housing Owner-Occupied % of Units, by Zip Code (ZCTA5) — Phoenix Metro
- Housing % of Units Built Since 2010, by Zip Code (ZCTA5) — Phoenix Metro
- Housing Vacancy Rate by Zip Code (ZCTA5) — Phoenix Metro
- Housing Owner-Occupied Median Value ($), by Zip Code (ZCTA5) — Phoenix Metro
- % of Population without Health Insurance, by Zip Code (ZCTA5) — Phoenix Metro
- Household Average Size by Zip Code (ZCTA5) — Phoenix Metro
- Bachelor's Degree or Higher (% of Over 25) by Zip Code (ZCTA5) — Phoenix Metro
- Population Hispanic % by Zip Code (ZCTA5) — New Hampshire
- Population Hispanic % by County
- High School Graduate (% of Over 25) by Zip Code (ZCTA5) — Los Angeles Metro
- Population Non-Hispanic American Indian % by Zip Code (ZCTA5) — Los Angeles Metro
- Median Age by Zip Code (ZCTA5) — Los Angeles Metro
- Population Hispanic % by Zip Code (ZCTA5) — Los Angeles Metro
- Population Non-Hispanic Black % by Zip Code (ZCTA5) — Los Angeles Metro
- % of Population on Food Stamps or SNAP (Last 12 Months), by Zip Code (ZCTA5) — New York Metro
- Housing Vacancy Rate by Zip Code (ZCTA5) — New York Metro
- Population Non-Hispanic White % by Zip Code (ZCTA5) — Los Angeles Metro
- U.S. Citizens (% of Population Over 18) by Zip Code (ZCTA5) — Los Angeles Metro
- Housing Median Monthly Rent ($), by Zip Code (ZCTA5) — Virginia
- Housing Owner-Occupied % of Units, by Zip Code (ZCTA5) — Virginia
- Housing % of Units Built Since 2010, by Zip Code (ZCTA5) — Virginia
- Population Non-Hispanic American Indian % by Zip Code (ZCTA5) — Virginia
- Population Non-Hispanic Black % by Zip Code (ZCTA5) — Virginia
- % of Households with Broadband Internet, by Zip Code (ZCTA5) — Virginia
- % of Population without Health Insurance, by Zip Code (ZCTA5) — Virginia
- Housing Owner-Occupied Median Value ($), by Zip Code (ZCTA5) — Virginia
- High School Graduate (% of Over 25) by Zip Code (ZCTA5) — Virginia
- Married Couple (% of all Households) by Zip Code (ZCTA5) — Houston Metro
- Married Couple (% of all Households) by Zip Code (ZCTA5) — Miami Metro
- Married Couple (% of all Households) by Zip Code (ZCTA5) — Dallas Metro
- Married Couple (% of all Households) by Zip Code (ZCTA5) — Boston Metro
- Married Couple (% of all Households) by Zip Code (ZCTA5) — Tampa Metro
- Married Couple (% of all Households) by Zip Code (ZCTA5) — Austin Metro
- Married Couple (% of all Households) by Zip Code (ZCTA5) — Detroit Metro
- Married Couple (% of all Households) by Zip Code (ZCTA5) — Portland Metro
- Married Couple (% of all Households) by Zip Code (ZCTA5) — Atlanta Metro
- Married Couple (% of all Households) by Zip Code (ZCTA5) — Chicago Metro