NOTE: Gray indicates insufficient data or a suppressed estimate.
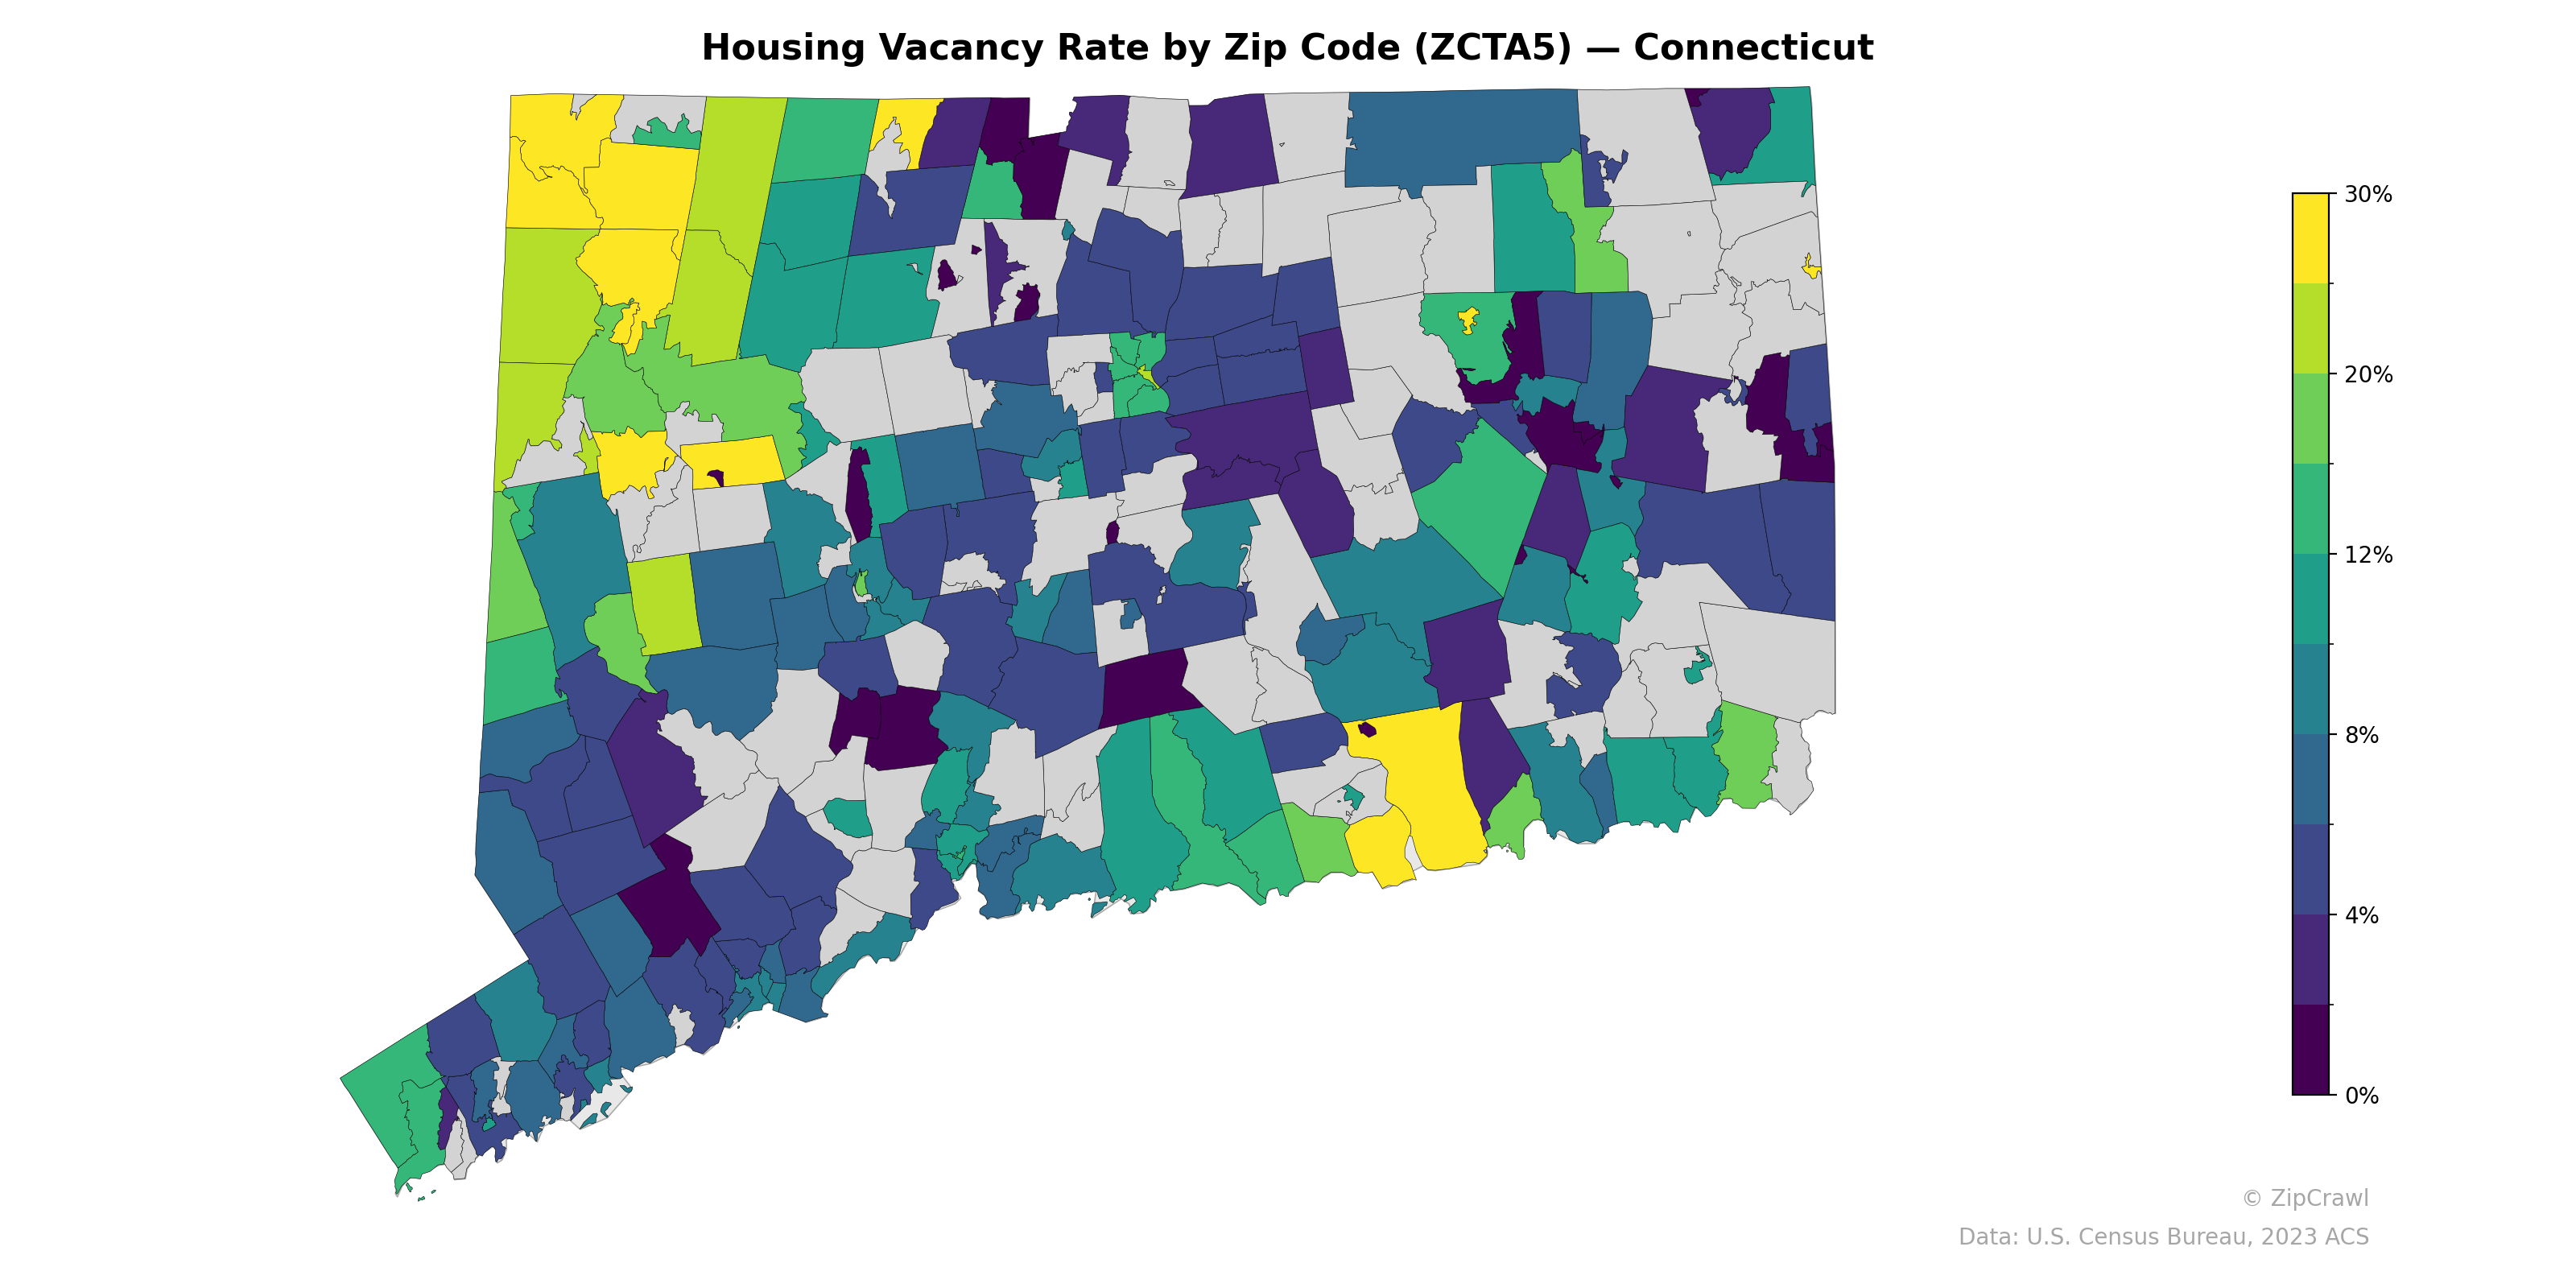
The northwest corner of Connecticut exhibits the highest housing vacancy rates, with several zip codes exceeding 20–30%, consistent with the region's prevalence of seasonal and vacation properties in the Litchfield Hills area. Coastal zip codes along Long Island Sound and the southwestern Fairfield County corridor generally display lower vacancy rates in the 0–4% range, reflecting tight housing markets in commuter-heavy suburbs near New York City. A scattered pattern of moderate vacancy (8–12%) appears across the central Connecticut River Valley, while pockets of very low vacancy near Hartford and New Haven likely correspond to high-demand urban cores interspersed with higher-vacancy neighborhoods.
Data: U.S. Census Bureau, 2023 ACS
Explore
- % of Population on Food Stamps or SNAP (Last 12 Months), by Zip Code (ZCTA5) — California
- Population Non-Hispanic White % by Zip Code (ZCTA5) — Utah
- Household Median Income by Zip Code (ZCTA5) — Utah
- U.S. Citizens (% of Population Over 18) by Zip Code (ZCTA5) — Utah
- Population Non-Hispanic Black % by Zip Code (ZCTA5) — Utah
- Median Age by Zip Code (ZCTA5) — Utah
- % of Population on Food Stamps or SNAP (Last 12 Months), by Zip Code (ZCTA5) — Connecticut
- Population Hispanic % by Zip Code (ZCTA5) — Utah
- Married Couple (% of all Households) by Zip Code (ZCTA5) — Connecticut
- Population Non-Hispanic Asian % by Zip Code (ZCTA5) — Connecticut
- Housing Owner-Occupied Median Value ($), by County
- Housing Owner-Occupied % of Units, by County
- High School Graduate (% of Over 25) by Zip Code (ZCTA5) — Florida
- Population Non-Hispanic Black % by Zip Code (ZCTA5) — Florida
- Population Non-Hispanic American Indian % by Zip Code (ZCTA5) — Florida
- Median Age by Zip Code (ZCTA5) — Florida
- Household Median Income by Zip Code (ZCTA5) — Florida
- Population Non-Hispanic White % by Zip Code (ZCTA5) — Florida
- Population Non-Hispanic Asian % by Zip Code (ZCTA5) — California
- U.S. Citizens (% of Population Over 18) by Zip Code (ZCTA5) — Florida
- % of Households with Broadband Internet, by Zip Code (ZCTA5) — Ohio
- % of Households with Broadband Internet, by Zip Code (ZCTA5) — California
- Population Hispanic % by Zip Code (ZCTA5) — Florida
- Housing Median Monthly Rent ($), by Zip Code (ZCTA5) — Connecticut
- Median Age by Zip Code (ZCTA5) — Iowa
- High School Graduate (% of Over 25) by Zip Code (ZCTA5) — Connecticut
- Housing % of Units Built Since 2010, by Zip Code (ZCTA5) — Connecticut
- Population Hispanic % by Zip Code (ZCTA5) — Mississippi
- Population Non-Hispanic American Indian % by Zip Code (ZCTA5) — Connecticut
- Housing Median Monthly Rent ($), by Zip Code (ZCTA5) — Nevada
- Housing Vacancy Rate by Zip Code (ZCTA5) — Iowa
- Housing Vacancy Rate by Zip Code (ZCTA5) — Utah
- Housing Vacancy Rate by Zip Code (ZCTA5) — Ohio
- Housing Vacancy Rate by Zip Code (ZCTA5) — Wyoming
- Housing Vacancy Rate by Zip Code (ZCTA5) — Maine
- Housing Vacancy Rate by Zip Code (ZCTA5) — Texas
- Housing Vacancy Rate by Zip Code (ZCTA5) — Hawaii
- Housing Vacancy Rate by Zip Code (ZCTA5) — Idaho
- Housing Vacancy Rate by Zip Code (ZCTA5) — Wisconsin
- Housing Vacancy Rate by Zip Code (ZCTA5) — Oregon